Blog

  • Workforce Optimisation for Service Businesses: The Margin Playbook

    Workforce Optimisation for Service Businesses: The Margin Playbook

    The version of workforce optimisation that actually matters

    Walk into a contact centre and workforce optimisation is about shift rosters and average handle time. Walk into a digital agency, a consulting firm, or a product studio and the phrase means something completely different. The people on the roster are not answering tickets. They are billing hours. Every hour that goes untracked, unapproved, or unbilled is not a scheduling inefficiency. It is lost margin.

    That distinction changes everything about how a service business should think about optimising its workforce.

    For a service business, your people are the product. The hours they deliver are the revenue line. The hours they cannot account for are the cost. Workforce optimisation in this world is not a roster-planning exercise. It is a margin discipline, built around a simple question: how much of every billable hour the team is paid for is actually showing up on an invoice?

    Most articles on this topic answer the wrong question. They were written for call centres, dressed up for 2026 with an AI layer, and pushed to anyone who typed “workforce optimisation” into a search bar. What follows is different. This is the version written for people running teams where the team is the product, and where a single undertracked week can wipe out a client’s profit for the month.

    What workforce optimisation really means when your team is the product

    In a service business, workforce optimisation is the practice of aligning what your people work on, how long it takes, and how that work is billed, so that billable utilisation, delivery quality, and client margin move in the same direction at the same time.

    Three numbers sit at the centre of it:

    Billable utilisation. The percentage of available capacity being spent on billable work. For most healthy agencies and consulting firms, this sits in the 65 to 80 percent range for delivery roles. Higher and your team is on the edge of burnout. Lower and you are either overstaffed, undersold, or losing hours to friction.

    Per-client margin. The profit earned on each client engagement after the cost of the hours delivered is subtracted from the revenue recognised. A client that looked profitable on contract can sit at 8 percent margin by month three because nobody was watching the hours.

    Backlog. The unearned portion of signed revenue. If you have sold $200,000 of work and delivered $75,000 of it, your backlog is $125,000. High backlog with low utilisation is a delivery problem. High utilisation with high backlog is a scoping problem.

    Optimising the workforce of a service business means moving all three in the right direction at once. Efficiency for its own sake, without a view of margin, is how you end up with a hyper-productive team that is still losing money on half its clients.

    💡 Pro Tip: If your workforce optimisation programme does not surface per-client margin as one of its primary metrics, it is operational hygiene, not optimisation. The two are often confused.

    The four components that actually move margin

    Reading the category blog posts, you could be forgiven for thinking workforce optimisation is mostly about AI, automation, and smart scheduling. Those are useful. But for a service business, they sit downstream of four more fundamental components, each tied directly to a line on the CFO Dashboard.

    1. Capacity that maps to capability, not headcount

    Capacity is not a headcount number. A team of ten with eight senior operators looks identical on a cost spreadsheet to a team of ten with three seniors and seven juniors. Their capacity for delivering senior-level work is not remotely the same.

    Workforce optimisation starts with mapping capacity by capability. In Skarya’s Resources module, every team member carries a Role, a set of Skills, and an Hourly Rate. Hours are allocated against projects and boards, and utilisation is tracked at the individual level. That means when a new client engagement lands, the conversation is not “do we have people available?” It is “do we have the right kind of hours available?” Those two questions produce very different staffing decisions.

    2. Time data that is tracked, approved, and trusted

    The single biggest point of failure in service business workforce optimisation is not the staffing model. It is the timesheet. Unsubmitted, unapproved, or casually estimated timesheets corrupt every downstream metric: utilisation is wrong, cost is wrong, margin is wrong, capacity forecasting is wrong.

    The fix is not more nagging. It is workflow discipline. Time has to be logged against a specific board or project, marked as billable or non-billable, and routed through a mandatory manager approval step before it feeds into any financial view. That is why Skarya’s Timesheets module includes an explicit approval gate. Only approved hours feed into Resources and the CFO Dashboard. The financial picture the business looks at is built from verified data, not self-reported noise.

    3. Allocation that reflects scope, not hope

    Most capacity planning is optimistic. A project is scoped at 120 hours, allocated 120 hours, and the team discovers by week three that it needs 180. By then, the margin has already collapsed and no amount of recovery reshuffling brings it back.

    Allocated Effort at the task level, compared against Actual Effort as the work progresses, is the simplest early-warning signal a service business can run. When the ratio is trending the wrong way on a specific engagement, the conversation with the client happens in week two, not month three. For a deeper look at how early effort variance ties into scope creep, see our piece on project scope management.

    4. Financial visibility the whole leadership team can see

    The last component is the one that turns workforce data into a decision. If the only people who see utilisation, cost, and margin are the finance team at month-end, nothing improves. By the time the report lands, the quarter is half over.

    What service businesses need is live visibility. Signed revenue, earned revenue, cost, margin, and backlog for every client, updated as the week progresses. In Skarya, this sits in the CFO Dashboard: a per-client P&L table that is populated automatically from approved timesheets and contract values, with risk flags for clients trending toward loss. It is not a finance tool. It is a workforce decision surface.

    💡 Pro Tip: The best delivery leads in agencies check per-client margin weekly, not monthly. By the time a monthly report lands, you have missed four chances to adjust staffing, scope, or pricing.

    The five strategies that actually work for service businesses

    These are the plays that move the three numbers. Pick the ones that match where your operation currently leaks the most.

    Strategy 1: Make every hour carry a billable flag

    The first move in any workforce optimisation programme is forcing every logged hour to declare itself as billable or non-billable at the moment it is entered. Not at end of quarter. Not at invoice time. At the point of logging.

    The effect is twofold. First, you instantly get a realistic utilisation number, because non-billable work is no longer disguised inside project hours. Second, you create a natural conversation every week about why the non-billable percentage is what it is. Internal training, admin, business development, and rework are all legitimate. What you are hunting for is the fourth bucket: work that should be billable, but is being absorbed because nobody raised a change order.

    Strategy 2: Tie capacity planning to approved hours, not estimated ones

    A capacity model built on how long the team thinks tasks will take is a wish. A capacity model built on approved, historical actuals is a forecast. The gap between the two is where workforce optimisation lives.

    Skarya’s Resources view connects the two directly. Allocated hours are shown next to Tracked hours (pulled from approved timesheets). When a team member consistently tracks 25 percent more hours than allocated on similar task types, that signal shows up as a utilisation and margin issue on the CFO Dashboard before it shows up as a delivery delay. The response is not to squeeze the team. It is to reprice, rescope, or reallocate.

    Strategy 3: Protect senior capacity by design

    Senior delivery hours are the most financially valuable asset a service business has. They are also the first ones to get burned on work that a mid-weight operator should be doing.

    The practical fix is building capacity allocation around role seniority, not just headcount. In board-level and project-level planning, tasks should carry an expected seniority level, and the scheduling pattern should protect senior hours for scoping, architecture, client strategy, and escalation. Every senior hour spent on a task a mid-level operator could have done is an invisible margin tax.

    Strategy 4: Run scope drift as a financial signal

    Scope drift is a financial event before it is a delivery event. The early signs are in the data long before they show up in a delayed launch: billable hours creeping past the allocated estimate, a growing trail of small “quick fixes” that never made it into a change order, discovery work extending while build hours sit idle.

    The workforce optimisation move is to treat scope drift as a leading indicator of margin erosion, not a project management headache. When allocated-versus-tracked ratios are flagged in Resources, and per-client margin dips are flagged on the CFO Dashboard, the conversation shifts from “are we on track?” to “are we still profitable on this engagement?”

    Strategy 5: Build the AI layer into the workflow, not around it

    This is where most workforce optimisation advice in 2026 goes wrong. The default recommendation is to add AI on top: an assistant here, a summariser there, a chatbot bolted to the side. The result is that teams have to leave their workflow to ask the AI something, copy an answer back in, and hope the context carries across. Adoption is shallow and the time savings are smaller than promised.

    The structural move is to run AI inside the workflow. Skarya’s Kobi assistant sits natively inside tasks, docs, forms, and boards. It can draft a task description from a single line, summarise a long board’s status for a client update, write a project report, or build an intake form from a sentence. Because Kobi operates on the same data that staff are already working with, the optimisation compounds rather than fragmenting. We covered the broader case for AI being a location problem rather than a mindset problem in our work management deep dive.

    💡 Pro Tip: Treat AI productivity gains as a workforce optimisation lever only when the AI lives inside the workspace the team already uses. Standalone chat tools produce measurable gains for individuals and almost no measurable gain for the business.

    The metrics that tell you it is working

    A workforce optimisation programme is only credible if you can prove it is working. For a service business, four metrics make the case.

    MetricWhat healthy looks likeWhat the red flag looks like
    Billable utilisation65 to 80 percent for delivery rolesBelow 55 percent signals underselling or overstaffing; above 85 percent signals burnout risk
    Per-client marginConsistently above your target (typically 25 to 35 percent for agencies)Two consecutive months below target on the same client is a structural issue, not a blip
    Backlog to capacity ratioBacklog burns down at a predictable weekly rateBacklog growing faster than it is being delivered means pricing, staffing, or scope is off
    Timesheet approval rateAbove 95 percent of submitted hours approved within five daysLow approval rates corrupt every other number on this table

    None of these metrics is complicated. The reason most service businesses do not run them weekly is not complexity. It is that the data lives in three or four different systems, and pulling it together takes a person a day. That is the real argument for a platform where tasks, time, clients, and financial data live natively in one model. The metrics stop being a reporting exercise and become a live signal.

    How Skarya handles this in one connected model

    Everything above is a workflow argument. The platform argument is shorter. A service business running workforce optimisation properly needs its tasks, its time tracking, its resource allocation, and its financial performance data to live in the same system, updated in real time, visible to the people who make the staffing and pricing decisions.

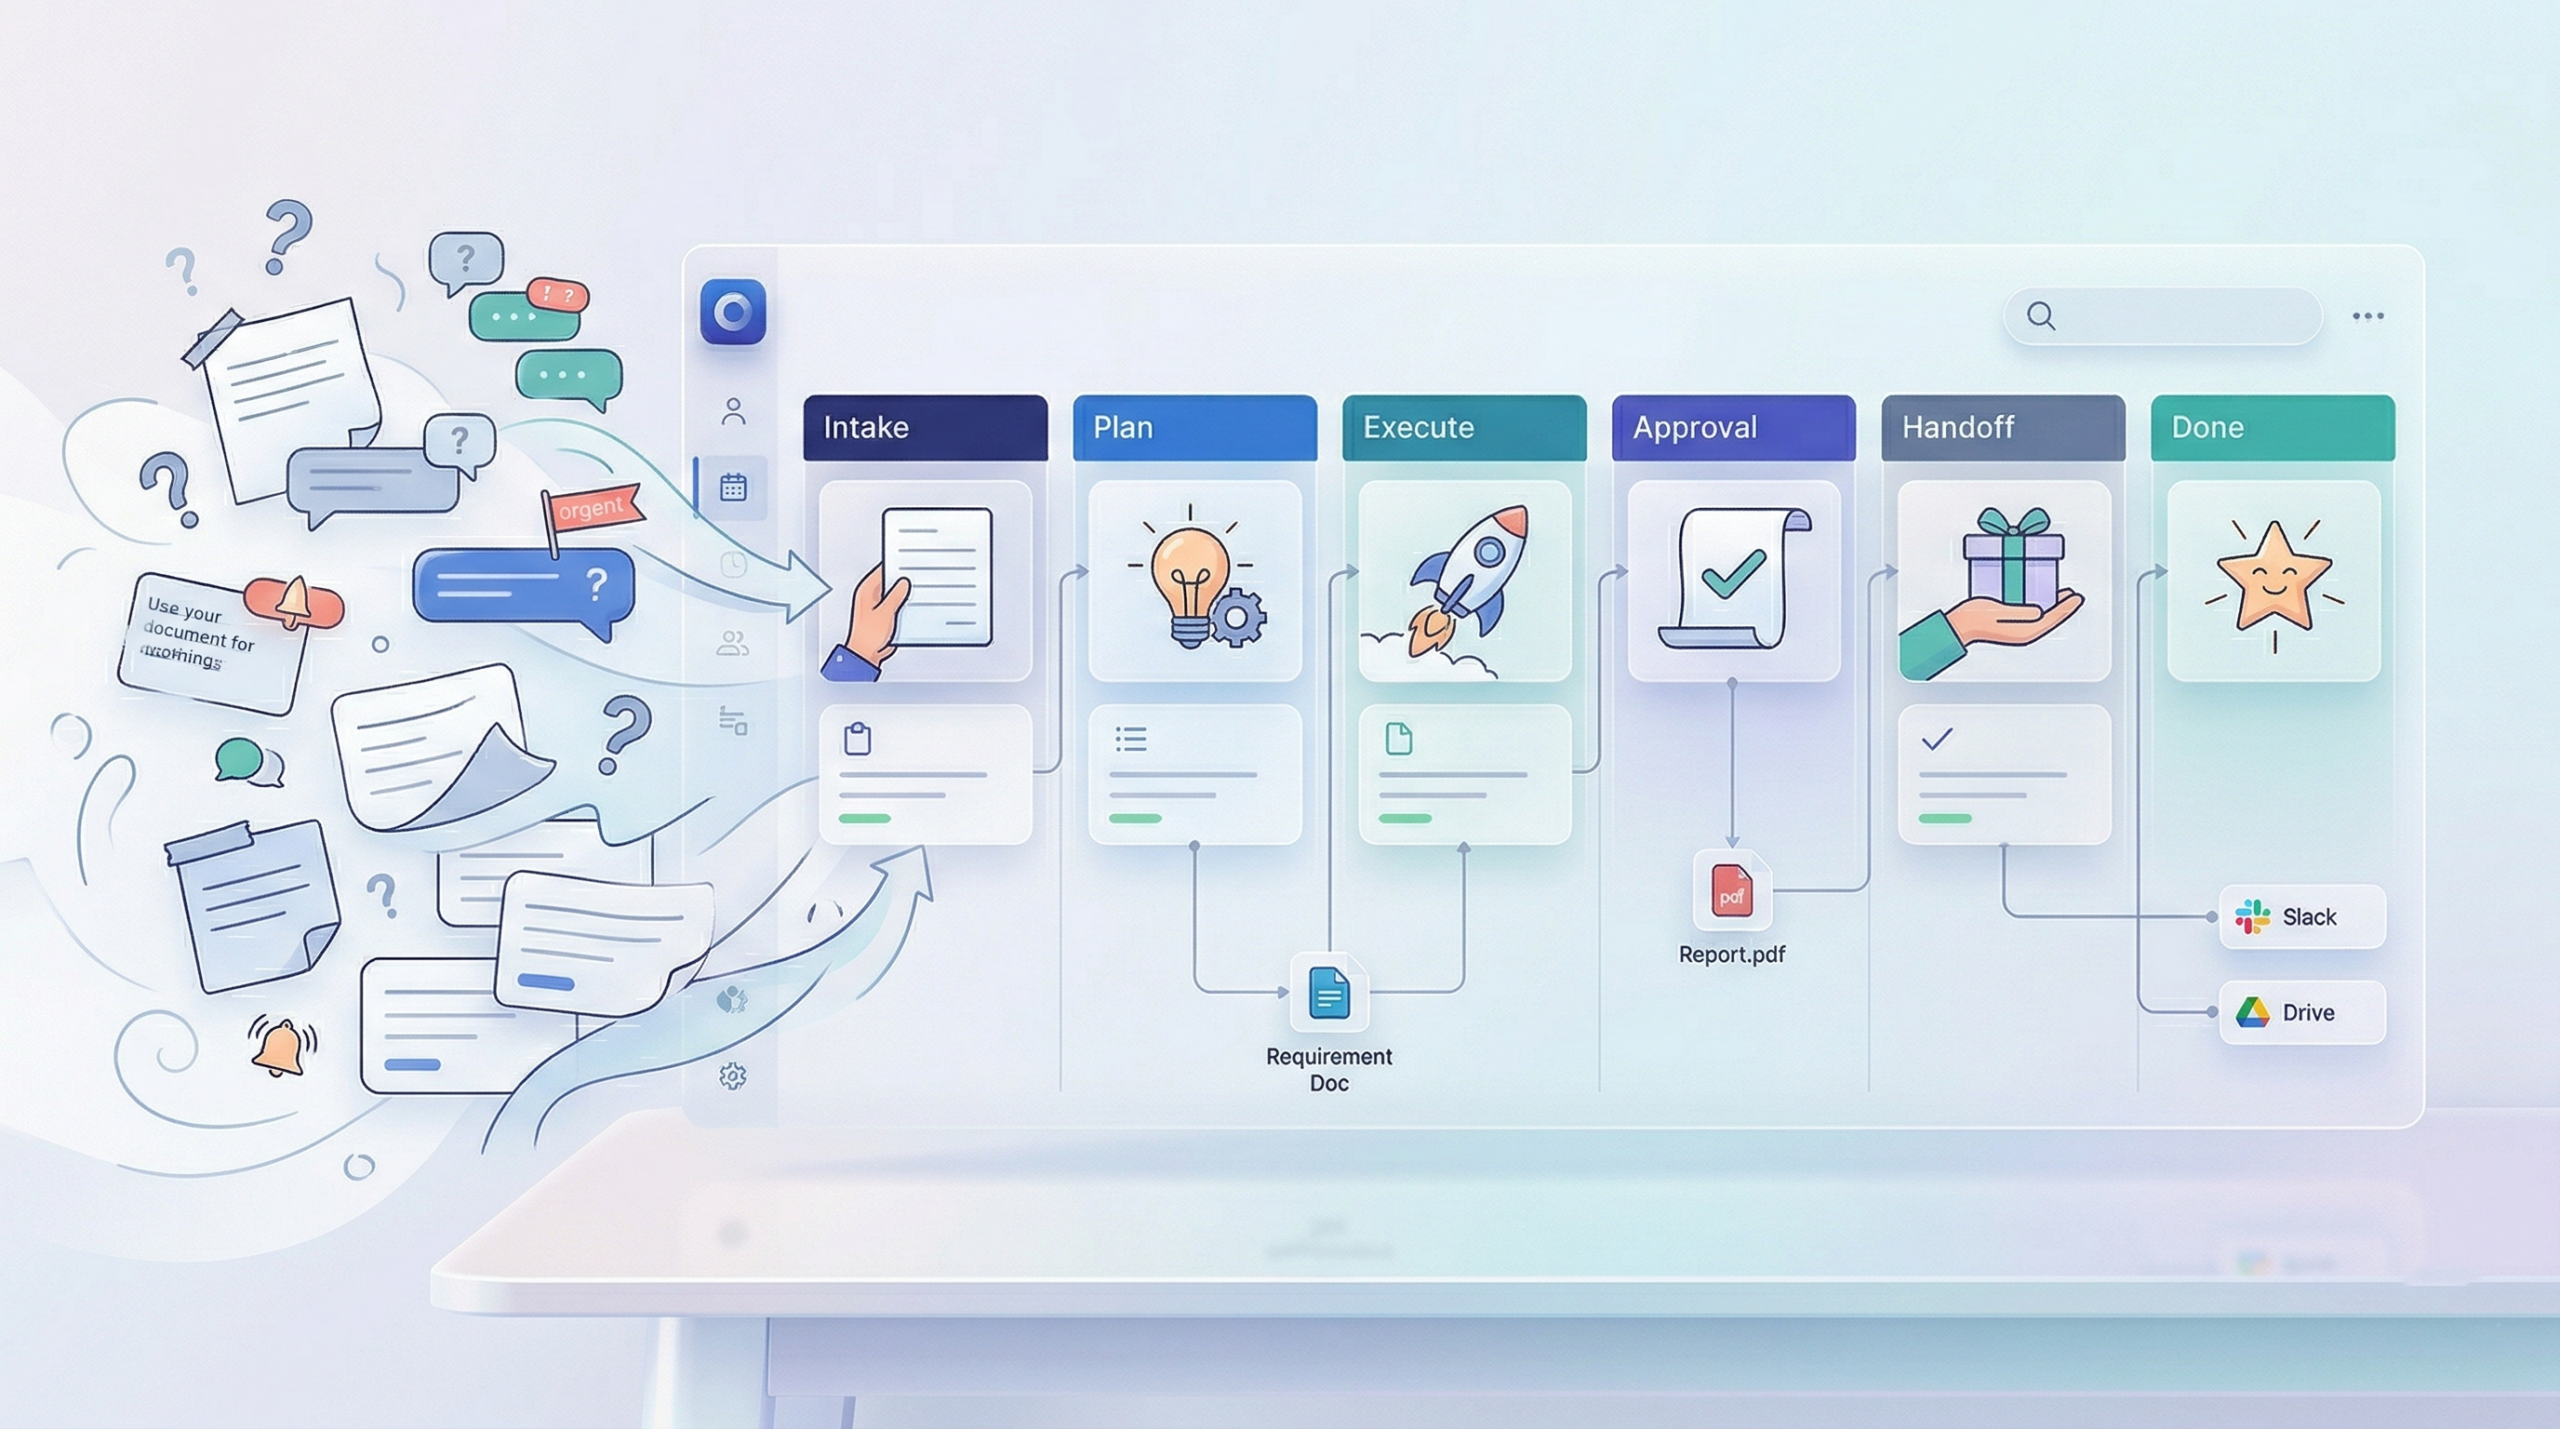
    Skarya is built around that model. Boards capture the work and the billing model. Timesheets capture the hours, routed through manager approval. Resources translates approved hours into cost, utilisation, and margin. The CFO Dashboard presents the per-client P&L and the risk flags. Kobi sits inside the whole thing, doing the drafting, summarising, and reporting work that used to take delivery leads out of their week.

    There are no third-party integrations stitching the picture together, because the picture is native. Utilisation and margin update as timesheets are approved. Backlog updates as revenue is earned. Risk is flagged as clients trend toward loss. A studio head does not wait for month-end to see where the business stands.

    What to do on Monday

    If you are running a service business and workforce optimisation has been on the agenda but never on the calendar, the first week of work is unglamorous and decisive.

    Start with a clean capacity map: every team member, their role, their skills, their hourly rate, their allocation by project. Get timesheets flowing with mandatory billable flags and a manager approval step that actually runs. Set per-client margin targets and publish them to the delivery leads. Look at the CFO Dashboard at the end of that week and identify the two clients where margin is furthest from target. Those two clients are your optimisation programme for the next month.

    Everything else, the AI layer, the scheduling automations, the dashboard refinements, is downstream of those four moves. Service businesses do not fall behind because they failed to adopt the latest optimisation technology. They fall behind because the basics, tracked hours, approved time, mapped capacity, visible margin, were never fully wired into the way the team works.

    Frequently asked questions

    What is the difference between workforce management and workforce optimisation for a service business?

    Workforce management covers the operational mechanics: rostering, time tracking, leave, and compliance. Workforce optimisation is the broader discipline of aligning capacity, work, and financial outcomes so that billable utilisation, delivery quality, and client margin move together. For a service business, workforce management is a subset of workforce optimisation. Doing rosters well does not mean you are optimising. It means you are staffed.

    How is workforce optimisation for an agency different from workforce optimisation for a contact centre?

    In a contact centre, the currency is tickets resolved per hour, and the optimisation work is mostly about forecasting volume and scheduling shifts. In an agency or consulting firm, the currency is billable hours realised against signed contracts, and the optimisation work is about mapping capacity to capability, approving time accurately, protecting senior hours, and tracking per-client margin in real time. The metrics, the levers, and the risks are all different.

    What is a healthy billable utilisation rate for a digital agency?

    For delivery roles in digital agencies and consulting firms, billable utilisation of 65 to 80 percent is typically healthy. Below 55 percent suggests you are either overstaffed for your current pipeline or underselling your team’s capacity. Above 85 percent sustained over a quarter is a burnout risk and a sign that you are underpriced, understaffed, or both. These are ranges, not rules. The exact target depends on role seniority, business development expectations, and non-billable time required for training and overhead.

    How do you track workforce optimisation without spreadsheets?

    By running tasks, time tracking, resource allocation, and financial performance in a single connected system rather than four disconnected ones. When approved hours automatically flow into utilisation calculations, and those calculations flow into per-client margin on a live dashboard, the spreadsheet disappears. Skarya is built around this model: Boards, Timesheets, Resources, and the CFO Dashboard share one data layer so workforce optimisation metrics are updated continuously, not assembled monthly.


  • How to Be a More Approachable Manager

    How to Be a More Approachable Manager

    There’s a manager I once worked with who was convinced his door was always open. He said it in every team meeting. He meant it. He genuinely believed it.

    Three people on his team told me, separately, that they’d stopped bringing things to him six months earlier.

    Not because he was cruel. Not because he’d said no to something important. Because every time they’d walked in, he looked up from his laptop with a half-second of visible irritation before catching himself, and that half-second had added up.

    This is the gap that defines approachability. It’s not what you intend. It’s what the person walking toward you actually experiences in the first two seconds.

    Approachability is a skill, not a personality

    Most advice on this topic is about posture. Smile more. Uncross your arms. Make eye contact. Keep your tone warm.

    None of that is wrong. It’s just surface. A manager can do all of it and still be the person nobody wants to interrupt.

    What actually makes someone approachable at work isn’t warmth in the abstract. It’s the behaviour they default to in three specific moments and those moments have almost nothing to do with body language. They have to do with how you handle being pulled out of what you were doing.

    💡 Pro Tip: There’s a simple test. When someone on your team says “do you have a minute?”, pay attention to the first thing you say back. If it’s “is it quick?” or “what’s up” said while still typing, you’ve already given them the answer. People read speed, tone, and attention before they read words.

    That’s the real skill. Not friendliness the willingness to stop.

    The three moments where approachability is actually built

    Approachability gets decided in interruptions, disagreements, and bad news. Get these three right and the rest takes care of itself.

    When someone interrupts you. Most managers handle this badly because they split their attention half on the person, half on the thing they were in the middle of. The person feels it instantly. A better instinct: turn your body, close the laptop (or close the doc), and give them the full thirty seconds it takes to understand what they actually need. If you genuinely can’t right now, say so cleanly. “Give me twenty minutes and I’m yours” is approachable. “Yeah, what is it” while still typing is not.

    When someone disagrees with you. The test is whether your first reaction is curiosity or defence. Managers who get this wrong don’t realise they’re doing it they just start explaining their reasoning more thoroughly, which reads to the team as “I’ve already decided, I’m just waiting for you to catch up.” The behaviour that changes this is almost embarrassingly simple: ask one question before you respond. “What are you seeing that I’m not?” Then actually wait for the answer.

    When someone brings you bad news. This is the one that matters most, and the one most managers fail silently. The wrong move is to immediately problem-solve or, worse, visibly deflate. Both teach the team that bringing you bad news has a cost. The right move is to thank them for telling you first, ask what they need, and save the problem-solving for after they’ve finished talking. Teams remember who stayed calm when they were the messenger.

    These aren’t soft skills. They’re the specific behaviours that decide whether people keep coming to you or quietly stop.

    The “but I’m genuinely busy” problem

    Here’s the honest objection most articles on this topic skip past.

    You’re a manager. You’re running a team, shipping work, managing a client, trying to think. You cannot drop everything every time someone walks up to your desk. Pretending otherwise is a fantasy that leads straight to burnout.

    The answer isn’t to be available constantly. It’s to make unavailability feel respectful instead of dismissive.

    Three things do most of the work. First, be honest about your focus time if you’re in a block, say so: “I’m head-down until 2, can this hold?” Most of the time, yes. Second, close the loop yourself: “come find me at 2, I’ll be free” is a promise people remember you kept. Third, give people a low-friction way to raise things that don’t need a live conversation.

    That last one is where structure helps. Somewhere in how your team works, there needs to be a surface where someone can log a question, a concern, or a half-formed observation without needing to schedule time or catch you between meetings. A comment on a task. A shared doc they can flag. A canvas the team thinks in together. In Skarya, the comment thread on a task and a shared doc both exist for exactly this reason a place to say something that isn’t urgent enough to interrupt but matters enough to capture. When the live channel isn’t available, the async channel has to be.

    Managers who only offer real-time access end up with teams who save things up until they explode. Managers who offer both end up with teams who tell them things earlier, when they’re still small.

    Why this matters more than it looks

    The cost of unapproachability isn’t dramatic. It’s slow. Small issues become big ones because nobody mentioned them in week two. The best people on the team stop flagging concerns because it’s easier not to. Clients hear about problems before you do. Turnover happens for reasons that never quite made it into an exit interview.

    By the time a team “doesn’t bring things up anymore,” the manager has already lost more than they realise. They’ve lost the early-warning system that good teams run on. And they almost never connect it back to how they responded to an interruption eight months ago.

    That’s the part worth sitting with. Approachability isn’t a feeling. It’s a compounding input into how much truth your team tells you and how early they tell it.

    The shift

    Approachability isn’t something you broadcast. It’s something people experience, one interaction at a time, and it’s almost never the manager who gets to decide whether they have it.

    The only person who can tell you whether you’re approachable is the person standing in front of your desk, deciding whether to knock.

    Pay attention to how they look when they do.

  • What Is Team Collaboration? 10 Strategies That Work in 2026

    What Is Team Collaboration? 10 Strategies That Work in 2026

    Team collaboration is the engine behind every project that ships on time, every client that renews, and every margin number that doesn’t slip in the second half of the quarter. The way it actually works in 2026 looks different from even two years ago. Teams are more distributed, tool stacks are more fragmented, and the gap between a team that collaborates well and a team that just holds meetings shows up very quickly on the P&L.

    At Skarya.ai, we think about collaboration the same way we think about any operational system. It has inputs, it has outputs, and it either produces a profitable delivery or it doesn’t. That lens is what we’ll walk through in this guide, along with ten strategies that service businesses, agencies, and project-led SMBs can put into practice this quarter.

    Whether you’re running a five-person studio or a growing consultancy with offices across three cities, the fundamentals are the same. The execution is where everything changes.

    Let’s get into it.

    What Is Team Collaboration?

    Team collaboration is what happens when two or more people contribute their work, ideas, and time toward a shared outcome. It sounds simple on paper. In practice, collaboration requires three things running quietly in the background at all times: clear communication, mutual trust, and genuine visibility into what each person is doing.

    When all three are in place, collaboration produces the best work a team is capable of. When one of them goes missing, you get the symptoms every project leader knows by heart. Duplicated effort. Missed deadlines. Silent assumptions that blow up in client meetings. The creeping sense that nobody really knows what’s going on.

    Why Team Collaboration Matters More in 2026

    A few things have shifted in the last two years that make collaboration less of a soft skill and more of an operational discipline.

    First, team distribution is permanent. Hybrid work stabilised somewhere around 2024, and most service businesses now run with at least some fraction of the team working from different cities or time zones. Real-time is harder. Async is mandatory.

    Second, AI has moved from curiosity to co-worker. Kobi and similar AI assistants are doing drafting, summarising, and reporting work that used to take humans hours. Teams that build AI into the flow of collaboration are measurably faster than teams that keep it in a separate browser tab.

    Third, margins have tightened. Clients expect more for less, and service businesses are under pressure to show where every hour went and what it produced. The bridge between how a team collaborates and whether an engagement is profitable has never been shorter.

    The tangible benefits of getting this right:

    Faster delivery

    When everyone can see the plan, the status, and the blockers in one place, work moves. Collaboration removes the friction between knowing what to do and actually doing it.

    Better decisions

    Alignment between different roles and perspectives produces decisions that hold up under scrutiny. A decision made by one person in a silo almost always needs revisiting.

    Higher retention

    Teams that feel coordinated stay. Teams that feel like they’re working in parallel channels start looking for the exit. Culture is downstream of whether people feel like they’re part of something that works.

    Cleaner client handoffs

    Collaboration gaps become client-visible the moment something falls through. Clean internal coordination is what makes your account manager look good in the next review meeting.

    Healthier margins

    When time, tasks, and revenue flow through one system, there’s no hiding the projects that are quietly losing money. Good collaboration is also good financial hygiene.

    Types of Team Collaboration

    There’s no single way a team collaborates, and the best teams mix several modes depending on the task at hand. Six types worth knowing:

    1. Asynchronous collaboration. Team members contribute on their own schedule through shared documents, task updates, threaded comments, and messaging tools. Best for deep work and distributed teams.
    2. Synchronous collaboration. Everyone in the same virtual or physical room at the same time. Live meetings, working sessions, pair design. Best for complex decisions and relationship building.
    3. Cross-functional collaboration. People from different departments or disciplines working on one outcome together. A product launch involving design, engineering, marketing, and sales is the classic example.
    4. Parallel collaboration. Separate teams working on different tasks that feed into a shared deliverable. Common in agency production where creative, copy, and development run alongside each other.
    5. Hybrid collaboration. A combination of async and sync, usually with clear rules about which mode each type of work belongs in.
    6. AI-assisted collaboration. The 2026 addition to this list. AI tools generate drafts, summarise meetings, build forms, and draft client updates, and human team members edit, approve, and steer. Teams that treat AI as a genuine collaborator, not a novelty, get more done per person than teams that don’t.

    10 Team Collaboration Strategies for 2026

    1. Pick one platform where work, time, and money live together

    Collaboration falls apart when a team member has to check four different tools to understand what they’re supposed to be doing and whether the project is healthy. Tasks sit in one app, time is logged in another, client context lives in a third, and financial data is somewhere the team can’t even access.

    The single biggest collaboration upgrade any service business can make in 2026 is consolidating onto a platform where work, time tracking, and financial visibility are connected by default. Skarya.ai is built around exactly that principle. Tasks, timesheets, and the CFO Dashboard pull from the same data, so a team member logging a billable hour is contributing to the margin calculation in real time.

    2. Build genuinely cross-functional teams

    Assembly-line team structures made sense when every project was the same shape. In 2026, almost nothing is. Most client deliverables now need a strategist, a creative, a technical person, and a reviewer touching the same deliverable at different moments.

    Set up your boards and projects around outcomes, not departments. Give cross-functional members shared visibility into the same board. Use Assignee Groups in Skarya to route work to the right team without naming a specific person every time. A task assigned to ‘Design Team’ gets picked up by whoever has capacity, not whoever you guessed at when you created it.

    3. Make meetings actually focused

    Calendar creep is the silent productivity tax of the last five years. The fix isn’t fewer meetings in theory, it’s fewer meetings in practice, with tight agendas, named owners, and a written outcome at the end.

    A handful of rules that work for most teams:

    • Every meeting has a written purpose sent 24 hours ahead.
    • Every meeting ends with recorded decisions and next owners.
    • Any status update that can live in a board comment doesn’t need a meeting.
    • No meeting runs longer than 45 minutes without a break.

    You can use Skarya’s Docs module with Kobi to write meeting notes as you go and have Kobi produce a one-paragraph summary at the end, which goes straight into the project record where the work actually lives.

    4. Break down the silo between delivery and finance

    The most dangerous silo in a service business isn’t between teams. It’s between the people doing the work and the people watching the numbers. When delivery teams have no visibility into whether their project is profitable, they can’t self-correct. When finance teams have no visibility into what’s actually in progress, they’re always reporting on the past.

    This is why the CFO Dashboard in Skarya shows per-client margin, backlog, and risk in the same environment where tasks are managed. Delivery leads can see what a missed deadline or a scope-creep event actually costs in margin terms. Leadership can see the real-time health of every engagement without chasing anyone for a spreadsheet.

    5. Set team norms and make them visible

    Collaboration without norms is just group work. Norms define how your team handles the things that come up every day. How quickly a comment should be answered. What gets escalated versus absorbed. How decisions are recorded. Who owns what when an account manager is on leave.

    Write them down. Put them in a Skarya Doc pinned to the workspace. Reference them when something goes sideways. Update them when you learn something new. Norms are living documents, not plaques on a wall.

    6. Go async by default, sync by intention

    The healthiest distributed teams in 2026 run on async as the baseline and use sync time only for decisions, relationship building, and work that genuinely needs thinking together in the moment.

    Default async practices that scale:

    • Project updates posted in a shared thread, not asked for in a meeting.
    • Decisions proposed in writing with a 48-hour window for objections.
    • Feedback given on documents, not in calls.
    • Daily check-ins written in a board comment, not spoken in a standup.

    When sync time becomes scarce, it becomes valuable. That’s the inversion most teams still need to make.

    7. Standardise your intake

    Every collaboration problem we’ve seen inside a service business has some version of ‘the brief was bad’ at its root. Standardising intake fixes a surprising amount of it in a single day.

    Build one intake form per service type using Skarya’s Forms module. Ask for the context you actually need. Scope, budget, deadline, decision-maker, success criteria. Map each field to a task in the relevant delivery board. The form submission becomes the task, the task carries the context, and nobody on the delivery team is guessing what was agreed in the sales call.

    8. Embed AI where work already happens

    There’s a pattern across every team we’ve seen adopt AI well. They don’t treat it as a separate destination. They embed it into the place where the work already lives.

    Kobi is built around this idea. Instead of switching to a chat tab every time you need AI help, Kobi is available inside the task description you’re writing, inside the doc you’re drafting, inside the board you’re summarising. A task description drafts itself from a one-line prompt. A long meeting document becomes a two-sentence brief. A project status report writes itself from what’s already in the data.

    Teams that adopt AI this way see it become routine within weeks. Teams that keep AI in a separate app see adoption plateau after the initial novelty wears off.

    9. Use templates for anything you do more than twice

    If your team runs the same onboarding every time a new client signs, the same content review cadence every week, the same post-project wrap-up every time an engagement closes, template it.

    Skarya’s board and project templates let you save the full structure. Tasks, statuses, custom fields, assignees, dependencies, the lot. The next time the same kind of engagement lands, you clone the template and everyone on the team starts from the same baseline. Less briefing, fewer judgement calls, more capacity for the actual work.

    10. Close the loop with time data

    Collaboration without feedback is a guess. The data that tells you whether your team is actually collaborating well is already being captured every day, as long as you’re running timesheets.

    Watch for the signals: hours logged against non-billable categories creeping upward. Tracked hours far exceeding allocated effort on specific task types. The same team member showing up as a bottleneck week after week. These are all collaboration signals hiding inside time data.

    The Resources module in Skarya surfaces exactly this by turning approved timesheets into per-person utilisation, per-project cost, and per-client margin. The data your team is already generating becomes the input for the next round of collaboration improvements.

    Team Collaboration Tools Every Service Business Needs in 2026

    A minimum viable collaboration stack in 2026 covers six categories. Most service businesses need all of them; what changes is how tightly they’re integrated.

    A connected work management platform. The centre of gravity for tasks, timelines, clients, and team visibility. Skarya is built for service businesses where financial context matters. Tasks, clients, timesheets, and the CFO Dashboard are connected by default rather than sitting in separate tools you have to reconcile manually.

    A team chat tool. Something for the conversational layer like Slack or your existing workplace messaging system. Best kept for fast questions and social connection. Don’t use it as a project status tool; chat is where status updates go to die.

    A shared document and knowledge layer. Where SOPs, briefs, meeting notes, and reference docs live. Skarya Docs works at both the workspace and the board level, which means client-specific documentation stays tied to the client’s delivery board instead of floating in a general drive.

    A video conferencing tool whatever your team already uses for remote sync time. For the sync collaboration that genuinely needs faces and voices.

    A visual whiteboarding tool. For process mapping, brainstorming, and the thinking work that happens before work is turned into tasks. Skarya Canvas is an infinite whiteboard embedded inside every board, so the process diagram you draw up lives next to the tasks that execute against it.

    An AI assistant embedded throughout the platform. Kobi lives inside Skarya’s tasks, docs, and boards not in a separate tab or tool. The non-negotiable is that AI should be reachable from where the work is happening, not parked in a separate browser window.

    On-Site, Remote, and Hybrid Team Collaboration

    On-site collaboration

    Same office. Whiteboards, stand-ups, quick conversations by the coffee machine. On-site collaboration still works beautifully for high-context creative work, strategic planning, and the kind of problem-solving where someone needs to sketch something quickly and hand it across a desk.

    What makes on-site collaboration work in 2026 is recognising that you still need the digital layer. If your in-person conversations don’t end up as written decisions in a shared system, you’ve just created a knowledge asset that only three people have access to. Capture the outcomes of every in-person session in a Doc or board comment so the team members who weren’t in the room can stay oriented.

    Remote collaboration

    Distributed by default. The team might be spread across cities, countries, or time zones.

    The moves that actually work:

    • Over-communicate in writing. Assume the person reading has no context.
    • Run fewer synchronous meetings and make the ones you keep count.
    • Centralise everything in one platform. Don’t make remote team members hunt for context.
    • Celebrate wins publicly. A quick acknowledgement in a team channel carries more weight than it should.
    • Invest in a proper intake system so remote team members aren’t blocked waiting for briefs.

    Hybrid collaboration

    Some in, some out. Some days in the office, some days at home. This is where most service businesses actually live in 2026, and it’s also the mode where collaboration breaks down most often, because it tries to borrow from both models without committing to either.

    The rule that fixes about 80% of hybrid collaboration problems: treat every meeting as remote-first. If one person on the call is remote, everyone is remote. Everyone joins from their own laptop. Everyone contributes through the same digital channels. It feels slightly awkward in the physical room at first, but it removes the two-tier culture where the in-office people have conversations the remote team can’t see.

    Where Skarya Fits in All of This

    Good collaboration looks invisible when it works. People know what they’re doing, the work moves forward, the client is happy, and the margin at the end of the month is within 2% of what you quoted at the start.

    Skarya.ai is built to make that kind of collaboration the default rather than the exception. Tasks, boards, projects, timesheets, clients, and the CFO Dashboard are designed to work as one connected layer, so the team doing the work and the leadership watching the numbers are looking at the same truth in the same place. Kobi sits inside all of it, handling the drafting and summarising that used to eat your afternoons.

    If your current collaboration stack feels like it’s working against you, too many tools, too little visibility, too much manual reporting, Skarya is worth a look. Three users free on the Go plan, no credit card required, and you can be running a live workspace in under an hour.

    Start a free workspace at skarya.ai.

  • Project Scope Management: 7 Failures Hiding in Your Timesheets

    Project Scope Management: 7 Failures Hiding in Your Timesheets

    📌 Project scope management is the discipline of defining, approving, and controlling the work a project will deliver. In service businesses, the early warning signs of scope failure show up in the financial layer (timesheets, billable ratios, backlog, margin) days or weeks before they reach a status report.

    🗝️ Key Takeaways

    • Scope drift is a financial event before it is a delivery event, which is why timesheets and the CFO dashboard catch it before the project manager does
    • Seven recurring data signals (covered below) tell you scope is failing on a live engagement, often while the project still looks “on track”
    • Each signal has a specific cause and a specific fix, and most of them are addressable inside the running engagement rather than at month-end
    • Building scope discipline means watching the right numbers weekly and treating any drift as a change request conversation, not a delivery problem

    📋 TL;DR – Project scope management defines, approves, and controls the work a project delivers. In client services, scope problems almost always appear in operational and financial data before they show up in delivery. This guide walks through seven specific signals (billable hours outpacing signed revenue, backlog growing while margin shrinks, allocated hours quietly exceeded, and four others), what each one usually means, and what to do about it before the engagement loses money.

    What is project scope management, and why does the financial layer see problems first?

    Project scope management is the process of defining, approving, and controlling the work required to deliver a project’s outcomes. The familiar artifacts (scope statement, Work Breakdown Structure, scope baseline, change log) sit on top of a discipline that is really about one thing: keeping the work the team is doing aligned with the work that was sold.

    In client services, the gap between “work being done” and “work that was sold” almost always appears in the data first. Timesheets show effort going into things that were not in the original brief. Billable ratios shift. Backlog grows faster than delivery. Margin on a specific client starts trending down while everyone in the weekly status meeting is still saying things are fine.

    This is not a failure of project managers. It is a structural feature of how scope drift happens. Most scope changes are small, conversational, and approved verbally between a delivery lead and a client contact. The delivery lead knows about each one in isolation. Nobody sees the cumulative pattern until the numbers reveal it. By the time a status report flags a problem, the team has usually been absorbing scope for two or three weeks.

    💡 Tip – On most agency engagements, the gap between scope drift starting and a project manager flagging it in writing is between ten and twenty business days. The same drift shows up in timesheet and margin data within days. Knowing what to look for in that data is the difference between catching scope failure early and finding out about it on a quarterly P&L review.

    How do you read these signals?

    Each of the seven failures below follows the same shape. There is a signal you can see in your operational or financial data, a cause that explains what is actually happening behind it, and a fix that addresses it inside the live engagement.

    What you see in the dataWhat it usually means
    Billable hours climbing past signed revenue capacityScope has expanded without a fee change
    Same client raising three or more “small” requests a weekA renegotiation is overdue
    Discovery on track, build hours overrunningDiscovery deliverables underspecified the build work
    Actual hours quietly exceeding allocated on every taskOriginal estimates were optimistic, not the work
    Non-billable hours growing on a billable engagementScope-related work is being absorbed as overhead
    One client’s margin shrinking while their backlog growsDelivery cost is rising faster than recognised revenue
    Tasks appearing on boards without matching change requestsScope is being added without going through control

    Each one is worth treating as a discrete diagnostic, not a general “scope is bad” signal. The fix for each is different.

    Failure 1 – Billable hours are outpacing signed revenue

    The signal. Billable hours logged against a client engagement are running ahead of the rate implied by the signed contract value. On a A$60,000 retainer designed to absorb 400 hours over a quarter, the team has burned 340 hours by week six.

    The cause. Almost always: scope expansion approved verbally and not converted into a fee adjustment. The team is doing work the client expects to receive but the contract was never updated to cover. This is the single most common margin-loss pattern in agency work.

    The fix. Run the calculation now, not at month-end. Take the burned hours, multiply by the blended cost per hour, and compare to the earned portion of the signed revenue. If cost is outpacing earned revenue, schedule the renegotiation conversation this week. The longer it waits, the more uncomfortable it gets, because the absorbed work becomes the precedent for what the client expects at the original price. In Skarya, this pattern is visible the moment Signed Revenue and Total Cost diverge in the CFO Dashboard’s Client Summary.

    Failure 2 – The same client keeps raising “small” requests

    The signal. A specific client account is generating three or more small change requests per week. None of them individually feel large enough to formally re-scope. Cumulatively, they are a different engagement than the one in the original brief.

    The cause. The original scope was probably under-specified, the working relationship has shifted from project mode to “ongoing extension of the team” mode, or the client is using the lack of pushback as an indicator that small requests are free. Sometimes all three.

    The fix. Stop treating each request as an individual decision. Pull the last four weeks of small requests for that client into one list, total the hours, and present it back to the client as a single conversation. Either move them to a retainer model that prices the ongoing pattern, or formally re-scope the project with the additional work priced in. The renegotiation is much easier when the data shows a clear cumulative pattern than when it relies on a delivery lead’s memory of “it feels like a lot of small things.”

    When does a small request become scope creep? A small request becomes scope creep the moment it is delivered without being assessed, priced, or approved through change control. Size is not the test. The test is whether the request was treated as a change to the agreed boundary. A 30-minute task that goes through change control is managed scope. A 30-minute task that gets done because “it’s only 30 minutes” is scope creep, especially because it almost never stays at one task.

    Failure 3 – Discovery scope holds, but build scope drifts

    The signal. Discovery delivered on time and on budget. The build phase started clean and is now consistently logging more hours per work package than estimated. Nothing dramatic per task, just a steady overrun across the board.

    The cause. Discovery deliverables specified what would be built but not how. The team is now resolving design and technical decisions in real time during build, and each unspecified decision adds hours. This is one of the most expensive failure patterns because it does not look like scope creep at first. Nobody is asking for new features. The team is just doing more work to deliver the same scope than the estimate assumed.

    The fix. Pause and review the discovery deliverables against the build work in flight. If the team is regularly making decisions that should have been made in discovery, that work is in-scope but under-estimated, and it deserves a conversation about either extending the timeline or formally re-scoping the build phase. The next project then needs a tighter discovery sign-off gate that explicitly tests whether the build team has everything they need to estimate without ambiguity.

    💡 Tip – Discovery sign-off and build protection are not the same thing. A signed-off discovery document only protects build scope if the build team confirmed during sign-off that they could estimate the work from it without further decisions. If they could not, discovery is incomplete regardless of what the client signed.

    Failure 4 -Actual hours quietly exceed allocated hours on every task

    The signal. Open the board’s task view and look at the allocated effort vs actual effort columns. If the actuals are running 20 to 40 percent over allocated on a majority of tasks (not just a handful), the issue is not the tasks. The issue is the estimate.

    The cause. Either the original estimates were systematically optimistic (often because they were anchored to a budget rather than to the work) or the team is doing more per task than was scoped (which is its own scope problem). Both cases produce the same data signal, but the fixes are different.

    The fix. Pick five tasks where actual significantly exceeded allocated and ask the assignee what the extra hours went into. If the answer is “additional work that came in mid-task,” that is unmanaged scope and needs change control. If the answer is “the original estimate was too tight for the actual work,” that is an estimating problem and needs the next project’s estimates revisited. In Skarya, the Resources view (Projects & Boards tab) shows allocated vs tracked hours per project in one place, which makes the pattern visible without having to dig through individual tasks.

    Failure 5 – Non-billable hours are growing on a billable engagement

    The signal. A client engagement that was scoped as fully billable is showing a rising share of non-billable time on weekly timesheets. Last month it was 8 percent. This month it is 18 percent.

    The cause. Scope-related work is being absorbed as overhead. Common forms: extra client calls that were not in the original communication plan, internal coordination time on changes that should have been formal change requests, or “quick fixes” that are quietly being miscategorised because the team knows they are out of scope and does not want to flag them as billable against an already tight budget.

    The fix. Reclassification is the wrong instinct. The work is real. It is being done. The question is whether it should be billable, and that is a scope question, not a timesheet question. Pull the non-billable entries for the engagement, identify which ones are scope-adjacent (almost all of them, usually), and treat them as the basis for a scope conversation with the client.

    What is the right ratio of billable to non-billable on a client project? For most client services engagements, billable utilisation between 70 and 85 percent of logged time is the realistic working range, with the remainder covering legitimate non-billable activity (internal status, account management, rework on quality). When the non-billable share rises noticeably above that for a specific engagement, it is usually a scope or estimating problem rather than an admin one. The fix is to look at what work is being absorbed, not to push the team to log more hours as billable.

    Failure 6 – One client’s margin is shrinking while their backlog grows

    The signal. In a per-client P&L view, one client is showing a downward trend in margin percentage over the last two or three months. At the same time, their backlog (signed revenue minus earned revenue) is increasing rather than decreasing.

    The cause. Cost of delivery is climbing faster than the rate at which the team can recognise the revenue. This is the most under-appreciated pattern in service business management because it looks healthy on the surface. Backlog growth often gets read as “good news, lots of work to do.” It is good news only if delivery cost is staying proportional. When backlog grows and margin shrinks at the same time, the work being delivered is becoming progressively less profitable, and the unearned revenue in the backlog is at risk of being delivered at the same eroded margin.

    The fix. Treat this as the highest-priority diagnostic on the list. Pull the engagement’s full picture in one view: signed revenue, earned revenue, cost, margin, and backlog. Identify which workstreams within the engagement are driving the cost increase. Decide whether to formally re-scope the remaining backlog at a higher fee, change the team mix delivering the work, or escalate the engagement for a strategic conversation. The CFO Dashboard’s Client Summary in Skarya is built for exactly this view, with backlog and margin on the same row per client so the pattern is visible at a glance rather than reconstructed from a spreadsheet.

    This is also the strongest argument for tracking the financial KPIs that matter for agencies at a per-client level rather than at a portfolio level. Portfolio-level margin can hide a client that is actively losing money behind two clients that are doing well.

    Failure 7 – Scope changes are happening without change requests

    The signal. New tasks are appearing on the project board that do not match anything in the original WBS, and the change log shows no corresponding change request for them. The work is being delivered. There is no formal record of how it got onto the board.

    The cause. The team has bypassed change control because the perceived friction of raising a formal change request is higher than the perceived size of the change. Often this is well-intentioned (“the client just needed a quick adjustment”) and almost always cumulative (“the client just needs another quick adjustment”).

    The fix. Make change request intake low-friction. A standing public form linked to the project board (in Skarya, this is a Form that creates a task automatically in the change-requests list) removes the activation energy. Then enforce one rule: any task added to the board that is not in the original WBS must reference a change request ID. The friction sits on adding the task, not on raising the request, which inverts the incentive in the right direction.

    💡 Tip -A working change request intake is one channel, one form, and one minute of effort to submit. If raising a change request takes longer than just doing the small thing, the team will always default to doing the small thing. Removing that friction is structurally more important than any policy about scope discipline.

    How do you build a scope discipline that catches these failures early?

    Five working practices catch most of the patterns above before they become engagement-level problems.

    • Watch the right numbers weekly, not monthly. Billable hours vs signed revenue, allocated vs tracked, billable ratio per engagement, and per-client margin trend. Monthly review is too late for any of them
    • Make change request intake frictionless. One channel, one form, one minute. The discipline depends entirely on the path of least resistance going through change control
    • Treat the change log as a leading indicator. A live engagement with zero change requests over a month is not a sign of clean scope. It is usually a sign that changes are happening and not being logged
    • Run a per-client P&L review monthly, not just a portfolio one. Portfolio margin hides the specific clients losing money behind the ones doing well
    • Tie scope decisions to the financial impact, not just the hours impact. “This adds 20 hours” is a delivery framing. “This changes engagement margin from 42 percent to 31 percent” is a commercial framing, and clients respond to it differently

    Conclusion

    Project scope management gets framed as a documentation discipline (the scope statement, the WBS, the change log), and those documents matter. But the discipline that actually protects margin in a service business is reading the operational and financial data weekly and treating any signal of drift as a scope conversation rather than a delivery one.

    Project managers do not catch scope drift first. The numbers do, if someone is watching them.

    If you are running client engagements and want timesheets, allocations, billable ratios, backlog, and per-client margin connected in one view rather than reconstructed from spreadsheets every month, that is what Skarya is built for.

    FAQs about project scope management

    What is the difference between scope creep and scope evolution?

    Scope creep is unmanaged change: work that gets added and delivered without being formally assessed, priced, or approved. Scope evolution is managed change: work that gets added through change control, with its impact on cost, timeline, and margin estimated and signed off before delivery starts. The work itself can be identical. The difference is whether the change went through the workflow that protects the engagement’s commercial integrity.

    How often should you audit scope on a live client project? Weekly for the operational and financial signals (billable hours, allocated vs tracked, billable ratio, change log activity) and monthly for the engagement-level review (per-client margin trend, backlog movement, scope statement still reflective of the work). Quarterly is too slow for client services. By the time a quarterly review surfaces a problem, the engagement has usually absorbed two to three months of unbilled scope.

    Who should be the first to spot scope drift on an engagement?

    On a well-instrumented engagement, the financial data spots it first and the delivery lead is the first person to read the signal. Most scope drift is invisible to the project manager in real time because each individual change feels small. The cumulative pattern only becomes visible in aggregated data, which is why scope discipline depends on someone reviewing operational numbers regularly rather than relying on the PM to catch every change as it happens.

    What financial metrics indicate scope is failing?

    Four metrics together give a reliable picture: billable hours vs signed revenue capacity (is delivery cost outpacing what was sold), allocated vs tracked hours per task (are estimates holding), billable utilisation per engagement (is non-billable absorbing scope work), and per-client margin trend with backlog movement (is the engagement becoming less profitable as it progresses). No single metric is conclusive. The combination is.

  • AI as a Team Partner: Why Embedded AI is Better Than Private Chats

    AI as a Team Partner: Why Embedded AI is Better Than Private Chats

    AI becomes a team partner the moment it stops living in a private chat tab and starts living inside the work itself, the tasks, docs, and decisions the team already shares. Anything else is just an expensive typewriter.

    Your Team Is Wasting AI in Private Tabs

    TL;DR AI usage is up. Team-level results are flat. The reason isn’t skill, training, or model choice. It’s location. When AI lives in a private ChatGPT tab, the speed is real but the output never enters the team’s shared knowledge. Move the AI inside the work and the math changes overnight.

    Two people on your team are using AI right now.

    Employee A is copy-pasting from ChatGPT in a side-tab. Employee B is working inside a task in their work platform, where the AI already knows the client, the brief, and the last deliverable. By Friday, both ship. Only one of them built a company asset.

    Guess which one is actually worth the licence fee.

    The location problem nobody is naming

    Most companies are tracking AI adoption like it’s the answer. It isn’t. Adoption is up almost everywhere. Team-level returns are not.

    The widely-cited Atlassian AI Collaboration Index puts the gap in plain numbers: teams treating AI as a shared teammate report roughly 2x the ROI of teams using it as a personal shortcut. That’s the only stat in this article. The rest is what we see every week working with agencies, consultancies, and project-led SMBs.

    AI is being used the way email was used in 2002. Privately. Individually. With no shared trail. Each person has their own prompts, their own chat history, their own preferred model. None of it surfaces in the boards, docs, or decisions the rest of the team relies on.

    That isn’t an adoption problem. It’s a location problem. The AI is in the wrong place.

    What “AI as a team partner” actually means

    Strip away the slogans. AI becomes a team partner when its inputs, conversations, and outputs sit inside the workspace the team already shares. Not next to it. Inside it.

    In practice that looks like:

    • AI summarising a board’s status from real tasks, dates, and assignees, not from a copy-paste.
    • AI drafting a task description from inside the task, where the title, client, and history are already context.
    • AI generating an intake form from a plain-language description, then mapping responses straight to fields on the right board.
    • AI reading a doc the team already wrote and answering questions about what it actually says, without anyone leaving the doc.

    In every case, two things happen at once. The person gets the speed. The team gets the visibility. The AI’s contribution becomes part of the same shared object everyone is already looking at.

    The math is simple. Embedded context equals 2x ROI. Private tabs equal a high-tech typewriter.

    Isn’t using ChatGPT or Claude already AI as a partner?

    Not in the team sense. Standalone chat tools are excellent thinking partners for individuals, and they should keep being used that way. The problem is that the conversation, context, and output stay locked inside one person’s account. For the team to get value, the AI’s contribution has to land inside the shared work where everyone else can see it, build on it, and challenge it. That’s the structural difference between a tool and a teammate.

    Four shifts that move AI from solo to shared

    Mindset is downstream of where AI lives. Move AI into the shared workspace and the right behaviours follow on their own. Four shifts make the move real.

    Shift 1: From private chats to shared context

    A prompt typed into a private chat box has only what you give it. A prompt asked from inside a task already knows the client, the deadline, the assignee, the linked doc, and the previous tasks in the same board. The context is free. And it’s shared by default.

    Pick one weekly task your team already runs (a status update, a brief, a meeting summary). Move the AI work for that task inside the shared workspace where the task already lives. Watch what changes about who can see and reuse the output.

    PRO TIP -Don’t ban private AI use. Move the high-leverage moments, the ones that affect more than one person, into the shared space first. The rest will follow.

    Shift 2: From speed to sharper decisions

    Most AI conversations start with “how much time can we save?” That’s a fair question with a low ceiling. Speed alone tends to create faster rework, not better decisions.

    A sharper question. Where could AI improve a decision the team is about to make? Client prioritisation. Scope trade-offs. Resource allocation. Project risk. Which retainer is bleeding margin. Which deal in the pipeline is worth pushing on this week. These are the moments where a second perspective synthesised from the team’s own data is worth more than ten minutes shaved off a task description.

    Shift 3: Stop training, start integrating

    Most AI rollouts begin and end with a training session. People learn the tool, the dashboard tracks logins, and three months later usage drifts back to whoever was already curious about AI before the rollout.

    People hate training. They love things that just work without thinking about them. So instead of training, build automated habits. Wire AI into rituals the team already runs. A weekly board summary generated automatically before the standup. A client report drafted inside the project before the monthly review. An intake form built by AI in five minutes when a new client signs. The ritual is the carrier. The AI becomes part of how the work happens, not a separate thing to remember to use.

    What’s the simplest first step a team can take to embed AI in shared work?

    Pick one ritual the team already runs every week and move the AI step inside the shared workspace where that ritual lives. Don’t try to embed AI everywhere at once. One ritual, one shared surface, one month. If the output is visible to the team and gets reused, you’ve found the pattern. Repeat it on the next ritual.

    Shift 4: From “AI will fix it” to “AI exposes it”

    AI is not a fix for unclear goals, fragmented knowledge, or weak documentation. It amplifies whatever is already there. Feed it muddled priorities and it produces confident-sounding nonsense. Feed it a board with clean fields, a linked client, and a written brief, and it produces something the team can actually use.

    The implication is uncomfortable. Investing in clean shared structure (clear task descriptions, named statuses, linked clients, written context) is also investing in better AI output. The two are the same project. Skip one and you’re paying for both to fail.

    This is what Kobi was built to do

    Skarya was built around a single observation. Most work management tools treated AI as something you’d open in a separate window and then paste back in. We didn’t think that worked. So Kobi (Skarya’s AI assistant) lives inside the work itself.

    Kobi does what ChatGPT cannot. It remembers your business context.

    From inside a task, Kobi drafts the description, names it, or rewrites it using the task’s actual context. Inside Docs, Kobi summarises content, answers questions about what the doc actually says, and writes new sections on request. Inside Forms, the AI Form Builder turns a plain-language description into a working intake form mapped to the right board fields. From a board view, Kobi generates a status summary or a project report from real data, no copy-paste, no re-uploading, no re-explaining who the client is.

    Standalone AI tools start every conversation from zero. Kobi starts every conversation already knowing the client, the project, the team, the financials, the timesheets, and what was decided last week. That’s not a feature. That’s the entire point.

    AI without your business context is a typewriter that talks back. AI inside your business context is a teammate.

    The real shift

    The move from “AI as a tool” to “AI as a teammate” isn’t a question of how people think about AI. It’s a question of where AI sits in the workflow.

    Move AI from a private tab into the shared workspace, and behaviour, visibility, and team-level returns follow. Leave it in the private tab and no amount of training, evangelism, or licence-counting will close the gap between rising adoption and flat metrics.

    The teams getting real returns from AI in 2026 won’t be the ones with the most prompts. They’ll be the ones whose AI conversations sit alongside their actual work, where the rest of the team can see them, build on them, and push back on them.

    Pick one ritual. Move the AI part of it inside the shared workspace. See what changes by next Friday.

    Frequently Asked Questions

    What does “embedded AI” mean compared to standalone AI tools?

    Embedded AI lives inside the workspace your team already uses (tasks, docs, boards, forms, dashboards), where it can read existing context and produce outputs the whole team can see. Standalone AI tools sit in separate browser tabs with their own private chat histories. Both can be useful, but only embedded AI naturally creates shared visibility into what AI is doing for the team and why.

    How do you measure the ROI of AI as a team partner versus a personal tool?

    Personal AI ROI is usually measured in time saved per individual, which is a low ceiling. Team-level AI ROI looks different: faster decisions, fewer dropped handoffs, better visibility into status and risk, higher quality of shared deliverables, less rework. Most of the gain shows up in cross-team coordination, not raw task speed. If your AI metric is “prompts per user,” you’re measuring the wrong thing.

    Which types of teams benefit most from embedded AI workflows?

    Service-led teams (digital agencies, consulting firms, marketing teams, professional services SMBs) tend to benefit most because their work depends on shared context across multiple clients, projects, and deliverables. Embedded AI keeps that context connected. Solo creators and very small teams may still get more value from standalone chat tools, since coordination overhead is lower.

    Can a small team get value from embedded AI, or is it only for large organisations?

    Small teams often see results faster than large ones. With fewer rituals to embed AI into and fewer silos to bridge, the time from “we tried this” to “this is how we work” is much shorter. The principle is the same regardless of size: pick one shared ritual and move the AI part of it inside the workspace the team already uses.

  • Strategy Execution Framework: A Founder’s Starter Guide

    Strategy Execution Framework: A Founder’s Starter Guide

    A strategy execution framework is the repeatable system a founder uses to turn a written strategy into weekly actions, clear owners, and honest feedback signals. It sits between the plan and the doing, and without it, most strategies quietly stall.

    🗝️ Key Takeaways

    • A strategy execution framework is not the strategy itself. It is the structure that converts that strategy into assigned weekly work with clear ownership.
    • Every working execution framework has four parts: priorities, owners, rhythm, and signals. Miss any one and execution drifts within weeks.
    • Most founder strategies fail because the plan is written in quarters but the team works in days, and no one builds the bridge between the two.
    • You can tell a framework is working long before the results arrive, by watching whether weekly decisions get easier, not harder.

    TL;DR: Most founder strategies don’t fail because the thinking was wrong. They fail because no one built the bridge between the quarterly plan and the weekly work. A strategy execution framework is that bridge. It has four parts: priorities, owners, rhythm, and signals. Get those four working together and you stop relying on heroics to ship your strategy.

    Why most founder strategies never leave the slide deck

    You’ve probably felt it. You spend a weekend building a strategy you genuinely believe in. You present it to the team on Monday. Everyone nods. Two weeks later, nothing has moved.

    This isn’t a motivation problem. It’s a translation problem. Strategy lives in quarters and themes. Work lives in days and tasks. The gap between those two timescales is where most early-stage strategies quietly die, and it has very little to do with whether the strategy was any good to begin with.

    Most first-time founders try to close that gap through sheer force of will. They repeat the plan in every standup. They send reminders. They chase. It works for a week. Then the noise of the business takes over and the strategy slides back into the slide deck.

    The founders who get past this stop trying to will the strategy into life. They build a small, boring system that does it for them.

    What is a strategy execution framework, really?

    A strategy execution framework is the repeatable structure that turns a written strategy into assigned weekly work, with clear ownership and honest feedback.

    It is not the strategy. It is not a goal-setting system on its own. It is the connective tissue between what you decided in the planning session and what actually gets done on Tuesday morning.

    Think of it this way. A strategy tells you where you’re going. A framework tells you how you check, each week, whether you’re still heading there.

    Plenty of named systems already do this. OKRsEOS, and 4DX are the three most common. Each one is a full-blown version of the same underlying idea: make the strategy visible, assignable, and reviewable on a cadence short enough for course correction. For most early founders, you don’t need a branded system. You need the four parts that sit underneath all of them.

    💡 Pro Tip: If you’ve ever said “we have a strategy, we just need to execute better,” the missing piece is almost always a framework, not more discipline. Discipline burns out. Structure doesn’t.

    The four parts every execution framework needs

    Every working execution framework, regardless of name, has the same four parts.

    Priorities. A short list of what actually matters this quarter. Three to five outcomes, not twenty. If everything is a priority, nothing is.

    Owners. One named person per priority. Not a team. Not a department. One human who wakes up responsible for it.

    Rhythm. A fixed cadence where priorities are reviewed and the next week’s moves are set. Weekly is the sweet spot for early teams.

    Signals. The leading indicators you watch to know if each priority is on track, before the lagging results show up.

    Miss any one of those and the whole thing leaks. Priorities without owners become suggestions. Owners without rhythm become silos. Rhythm without signals becomes theatre.

    ElementPlan-only approachFramework-driven approach
    PrioritiesListed in a deck, rarely revisitedVisible weekly, actively defended
    OwnersImplied by roleNamed, one per priority
    RhythmMonthly or ad hocWeekly, non-negotiable
    SignalsRevenue and churn (lagging)Behavioural and leading

    How do you break strategy into weekly moves?

    Here’s where most founders get stuck. The strategy says something like “become the default tool for boutique consultancies.” The Monday standup needs something like “ship the onboarding email sequence by Friday.” The move that connects those two is working backwards in exactly one step.

    Start with the quarterly priority. Ask: what does this look like at the end of the quarter, described as a visible outcome? Then ask: what has to be true in four weeks for that to be possible? Then: what has to be true this week? That last question is the one that goes into the weekly plan. Not the quarterly priority. Not the four-week milestone. Just the week.

    ❓ Does every priority need a weekly action? Yes, but not every week. Some priorities will have a quiet week where the owner is waiting on something, running an experiment, or in learning mode. That’s fine. What isn’t fine is a priority that has three quiet weeks in a row. That’s a priority the team has abandoned without saying so.

    💡 Pro Tip: Frame weekly moves as outcomes, not tasks. “Ship the onboarding sequence” is an outcome. “Work on the onboarding sequence” is a task. Outcomes end. Tasks can run forever.

    Where execution frameworks break, and what to do about it

    The failure mode is almost always the same. The framework starts strong in weeks one and two. By week four, the weekly review gets skipped once. By week six, the signals stop being reported because no one is watching them. By week eight, the team is back in reactive mode and the strategy is a document again.

    The weak link is almost always the signals layer. Priorities and owners are easy to name once. Rhythm holds for a while on founder enthusiasm alone. But signals require someone to look at the right numbers, in the right place, every single week, and ask a hard question about them. That job has no glamour, which is why it gets dropped first.

    This is the pattern we built Skarya around. Small teams need one place where priorities, owners, weekly rhythm, and signals all sit together, so the framework holds even when the founder gets pulled into a crisis. The framework matters more than any tool. But a good tool removes the excuses.

    How do you know it’s working before the results show up?

    Results are a lagging measure. By the time revenue moves, you’ve been executing well or badly for months. You need an earlier signal.

    The clearest one is whether weekly decisions are getting easier or harder. In a working framework, the weekly review gets shorter over time, not longer. Priorities stop needing to be re-explained. Owners start pre-empting their own blockers. The team stops asking “what should we work on” because the framework has already answered it.

    ❓ How long before a founder should expect to see results? Results lag the framework by one to two quarters on average for operational strategies, and longer for anything market-facing. But framework health is visible within three to four weeks. If the weekly reviews aren’t getting sharper by week four, something in the four parts is broken, and the founder should find it before waiting for the revenue number to confirm it.

    The shift from strategist to operator

    The hardest part of being a founder isn’t building the strategy. It’s making peace with the fact that the strategy is the easy half.

    The other half is a small, boring, repeatable system that converts your thinking into your team’s work, week after week, without needing you to hover. That isn’t execution theatre. That is the actual job.

    Build the four parts. Hold the rhythm. Watch the signals. The strategy will take care of itself.


    Frequently Asked Questions

    What’s the difference between a strategy and a strategy execution framework?

     A strategy is the decision about where you’re going and why. A strategy execution framework is the repeatable system that turns that decision into weekly work, assigned ownership, and honest progress signals. You need both. A strategy without a framework becomes a slide deck. A framework without a strategy becomes busywork with good project hygiene.

    Are OKRs a strategy execution framework? 

    Yes, OKRs are one version of a strategy execution framework, but not the only one. OKRs handle priorities and signals well through objectives and key results. They are typically paired with a weekly rhythm and clear ownership to complete the picture. EOS and 4DX are two other named systems that solve the same problem differently.

    How simple can a strategy execution framework be for a team of five? 

    Very simple. For a team of five, a framework can live in a single shared document: three priorities for the quarter, one named owner each, a 30-minute weekly review every Monday, and two leading signals per priority checked at that review. The framework doesn’t need to be sophisticated. It needs to be held.

  • 8 KPIs for Agencies Every New Owner Should Track

    8 KPIs for Agencies Every New Owner Should Track

    You can run an agency for two years before you notice something uncomfortable. The clients you love working with most are often the ones losing you money. The team looks busy. The invoices go out. The bank account climbs and then mysteriously slides back down. Nowhere on your screen is a single number that tells you whether any of this is actually working.

    That gap is what KPIs for agencies are supposed to close. Most beginner guides treat them as a vanity exercise: pick a dozen, stick them on a dashboard, present them in a quarterly board pack. That isn’t what they’re for. The real job of an agency KPI is to catch a problem on a Tuesday in March, not to look impressive in October.

    Here are eight to start with, why each one matters, and how to calculate it without a finance degree.

    What a KPI actually means for an agency

    A KPI is a number you’ve decided is worth defending. Not just measuring. Defending. If your gross margin is supposed to be 40% and it slips to 28%, that’s a number you act on, not one you note down. Every KPI on this list passes the same test. If it moves the wrong way, you can’t ignore it for long without something breaking somewhere expensive.

    Peter Drucker put the underlying principle bluntly: “What gets measured gets managed.” For an agency, the more painful inverse is the one to remember. What you don’t measure quietly eats your margin until you wonder where the year went.

    Start with profitability. Nothing else matters if the maths underneath is wrong.

    Profitability KPIs: the ones that decide if you stay in business

    These three tell you whether the work you’re doing is a business or an expensive hobby with clients.

    1. Client gross margin

    The single most useful number in your agency. It tells you how much profit each client is actually generating after you account for the cost of the people delivering their work.

    Formula: (Revenue earned from client − Cost of delivery) ÷ Revenue earned from client × 100

    Picture a 14-person agency with a flagship client on an $8,000 monthly retainer. Feels great. But the lead designer, two developers, and an account manager spend roughly 90 hours a month on that account. At blended rates that’s around $7,200 in delivery cost. Margin: 10%. You’re one sick week away from breakeven on your “best” client.

    💡 Pro Tip: Calculate this monthly per client, not quarterly across the whole agency. Quarterly averages hide the one or two clients dragging the studio down.

    2. Effective hourly rate

    Your contract might say $150 an hour. The number that matters is what you actually earned per hour the team actually worked. These are rarely the same thing.

    Formula: Revenue earned from client ÷ Total hours worked on that client

    The gap between the two is where scope creep lives. Effective hourly rate is the metric that catches it before the project post-mortem.

    3. Revenue backlog

    This one barely shows up in most agency KPI guides, and it’s the one that keeps senior owners up at night. Backlog is the value of work you’ve contracted for but haven’t yet delivered.

    Formula: Signed revenue − Earned revenue

    If you’ve signed $400K in contracts this quarter and only delivered $260K of work, you’re sitting on $140K of backlog. That’s not a brag. It’s a delivery bill you owe. Backlog climbing faster than capacity is the early warning sign of a year-end resourcing crisis.

    Delivery and capacity KPIs: your early warning system

    The next three tell you whether the team is built to actually fulfil what the profitability numbers assume.

    4. Billable utilisation rate

    The percentage of your team’s available hours that go to billable client work. Most beginner guides tell you to push it as high as possible. They’re wrong.

    Formula: Billable hours ÷ Total available hours × 100

    Healthy creative and consulting agencies usually sit between 65% and 80%. Above that and you have no slack for sales, training, or the small share of every project nobody can predict. Below 60%, you’re either underpriced or under-sold.

    5. Estimate accuracy

    Compare the hours you planned for a project against the hours it actually took. If you’re consistently 25% over, your scoping process is broken, and every margin calculation built on those scopes is fiction.

    Formula: Actual hours ÷ Planned hours × 100

    💡 Pro Tip: Track this as a rolling three-month figure per project type. A one-off overrun is noise. A repeating pattern is a process problem.

    6. On-time delivery rate

    The percentage of projects or milestones delivered by their committed date. This one looks operational, but it’s a leading indicator of retention. Clients almost never churn over price. They churn over the third missed deadline in a row.

    Client health KPIs: the long-game numbers

    The last two are about whether the agency you’re building has a future, not just a present.

    7. Client retention rate

    How many of last year’s clients are still paying you this year. Most owners track churn instead. Retention tells the truer story, because it reflects the relationships you’ve actively kept warm, not just the ones that haven’t blown up yet.

    Formula: (Clients at end of period − New clients added) ÷ Clients at start of period × 100

    8. Client concentration risk

    The share of your revenue coming from your single largest client. If that number is over 25%, you don’t really have an agency. You have a freelance contract with extra steps. Losing that client wouldn’t be a setback. It would be an extinction event.

    💡 Pro Tip: The 25% rule isn’t a law of physics. Some boutique agencies run happily at 40% with a long-tenured anchor client. Just know the risk you’re carrying and price the rest of your book accordingly.

    How to actually track all of this without losing your weekends

    You can do this in a spreadsheet. For about three clients. After that the maths goes out of date faster than you can update it, and you start spending Sunday evenings reconciling timesheets instead of doing anything that grows the business.

    That gap is the reason we built Skarya.ai. The CFO Dashboard shows signed revenue, earned revenue, cost, margin, and backlog as live numbers per client, populated automatically from approved timesheets and contract values. The eight KPIs above stop being a monthly chore and turn into something the team just sees, every day, without a separate finance ritual.

    Where to start if all eight feels like too much

    Pick three. Client gross margin, billable utilisation, and backlog. Those three together will tell you more about the health of your agency than any quarterly board pack ever has. Once they’re stable, the other five become useful. Not before.

    Tracking KPIs for agencies isn’t really about feeling in control. It’s about being in a position where bad news arrives early enough to do something about it. That’s the only metric that actually matters.

    If you’d like to see what your agency’s CFO Dashboard would look like with these numbers populated automatically, you can explore Skarya for free – no credit card, three users, every metric on this list built in.


    Frequently asked questions

    What’s the difference between an agency KPI and a metric?

    A metric is any number you can measure. A KPI is a metric you’ve decided to act on. Page views are a metric. Client gross margin is a KPI, because if it drops below your target, something has to change. The shortlist of KPIs for agencies should always be smaller than the list of available metrics.

    How many KPIs should a small agency track?

    For an agency under 30 people, between five and eight is usually right. Fewer and you’ll miss early warning signs on margin or delivery. More and the team stops paying attention because no single number feels urgent. The sweet spot covers profitability, capacity, and client health without anyone needing a dashboard cheat sheet.

    What’s a healthy gross margin for a digital agency?

    Most healthy creative and consulting agencies aim for a gross margin around 50% to 60% at the agency level, and at least 30% per client. Below 30% on a specific client you’re working for thin air. Below 40% at the agency level you typically can’t fund growth, profit-share, or downturn buffers without taking on debt.

    How often should agency KPIs be reviewed?

    Profitability and capacity KPIs (gross margin, utilisation, estimate accuracy) deserve a weekly look. Client health KPIs like retention and concentration are quarterly conversations. Reviewing everything monthly sounds disciplined, but in practice it means the urgent stuff like margin slipping mid-month gets caught too late.

  • How to Standardise Workflows for Operations Teams

    How to Standardise Workflows for Operations Teams

    Standardising workflows means defining consistent, repeatable steps for how your operations team handles recurring work  from intake to approval to completion  so the outcome is predictable regardless of who does it or when.

    Key Takeaways
    Workflow standardisation reduces the three biggest hidden costs in ops: unclear ownership, missed handoffs, and repeated decision-making on tasks that should already have a process.
    Effective standardisation starts with auditing, where work comes from  not with building documentation in a vacuum.
    The goal is fewer judgment calls, not more process. Your team should be able to execute without stopping to ask what the right approach is.
    Approvals fail because they live in inboxes and chat, not because approvers are unresponsive. Moving approvals into the workflow itself fixes most bottlenecks.
    Teams that centralise visibility spend significantly less time on manual follow-up and status chasing.

    How to Standardise Workflows for Operations Teams (Without Creating More Red Tape)

    TL;DR: This is a practical guide for operations managers, ops leads, and growing service teams dealing with messy handoffs, stalled approvals, and repeat work done differently every time. It walks through a five-step approach to building consistency across your ops workflows  without adding the kind of bureaucracy your team will ignore by week three.

    Why do operations teams keep reinventing the same wheel?

    If your team is handling recurring work  client onboarding, internal requests, approvals, resource allocation and each task still gets managed slightly differently depending on who picks it up, you have a workflow standardisation problem. Not a talent problem. Not a communication problem. A structure problem.

    This guide is for operations managers, ops leads, and founders handling ops in growing service businesses. The ones dealing with work that arrives through too many channels, approvals that disappear into email threads, and repeat tasks handled five different ways by five different people.

    Standardising workflows is the fix. Done right, it doesn’t mean bureaucracy. It means your team stops burning time on decisions that should already be made.

    What does it actually mean to standardise a workflow?

    Workflow standardisation means defining, documenting, and consistently applying the steps your team takes to complete a repeatable task so the outcome is predictable regardless of who does it or when.

    The distinction worth drawing early: standardising a process is different from standardising a tool. Plenty of ops teams buy a platform and call that standardisation. But if people still use different channels, different interpretations of done, and different methods for the same task, the tool just adds another layer of noise. Process comes first. Tooling supports it.

    💡 Pro Tip: Before you document a single step, agree on what ‘complete’ looks like for your most common task types. If your definition of done is fuzzy, your process will be too.

    Why do operations workflows break down in growing teams?

    There are four root causes that show up consistently, and they compound each other.

    Work comes from too many channels. Slack, email, in-person, project comments every channel is a separate queue someone has to manually triage. Most tasks don’t fail because they weren’t done. They fail because they were never properly received.

    Ownership isn’t defined until something breaks. Tasks get loosely assigned or assumed. When the handoff happens at 4:47pm over chat, the receiving person either misses it or doesn’t know what’s expected. The gap between one person’s ‘done’ and another person’s ‘started’ is where most ops failures live.

    Repeat tasks are handled by memory, not method. Every experienced team member has their own version of how a recurring task gets done  which works fine until they’re out sick, move on, or simply weren’t around when the task came in. Knowledge stuck in someone’s head is a liability.

    Approvals live in the wrong place. When approvals happen via email thread or Slack message, they get buried. Decisions stall not because the approver doesn’t care  but because the request never surfaced clearly enough to prompt one. The problem isn’t the person. It’s the system.

    “The bottleneck is never where you think it is. In operations, it’s almost always in the handoff  the space between one person’s done and another person’s started.”  Eliyahu Goldratt, The Goal

    Here’s what each breakdown looks like and what standardising actually changes:

    Common breakdownWhat standardisation fixes
    Work arrives via Slack, email, verbal requests, and chatA single intake channel or form  every request is logged
    Nobody’s sure who owns the task until something breaksNamed owners defined before work starts
    Approvals stall in inboxes for days at a timeApproval steps built into the workflow, not bolted on
    Same task is handled five different ways by five peopleDocumented steps anyone can follow without asking
    Progress is invisible chasing updates is a daily habitLive task boards where status reflects reality in real time
    Handoff context gets lost between people and systemsStructured handoff notes and task templates with required fields

    What does a standardised workflow actually look like in practice?

    Take client onboarding  one of the most common sources of chaos in service businesses. Without a standard process, onboarding happens differently every time: sometimes kicked off by an email, sometimes a Slack message, sometimes verbally at the end of a call. The result is missed steps, delayed starts, and new clients whose first experience is confusion.

    Here’s what the same workflow looks like when it’s standardised:

    StageWhat happensWho owns itWhat a standard process looks like
    IntakeClient onboarding request receivedOperations leadRequest submitted via intake form  not email. Logged automatically as a task.
    AssignmentTask routed to the right personOps lead or system ruleOwner named in the task. Due date set. Brief included in the task description.
    ApprovalScope or cost confirmation neededAccount managerApproval step built into the board  task can’t move forward until marked approved.
    ExecutionWork completed by assigned team memberDelivery teamProgress tracked on the board. Status updated in real time  no manual check-in needed.
    HandoffCompleted work handed to client or next teamDelivery leadCompletion marked. Handoff notes attached. Client notified via standard template.

    Every stage has a clear trigger, a named owner, and a defined outcome. Nobody has to remember what comes next. Nobody has to chase for an update. The same logic applies to purchase approvals, resource requests, or any other recurring operation in your business.

    How do you standardise workflows step by step?

    The temptation when starting this work is to jump straight to documentation. Resist it. You can’t write a useful process without first understanding what’s actually happening. Here’s the sequence that works.

    Step 1: Audit where work actually comes from

    What to do: Spend one week logging every incoming request  channel, task type, who handled it, and how long it took.

    Why it matters: Most ops teams are managing 6 to 8 intake channels when they should be managing 1 or 2. You can’t standardise a workflow if the entry point varies every time.

    What breaks if you skip it: You’ll document a process that only covers 60% of how work actually arrives  and the other 40% will continue to fall through the cracks.

    Step 2: Define ownership before you define process

    What to do: For each category of recurring work, name a single owner. Not a team  a person. Ownership means accountability for it being done correctly, not necessarily doing it themselves.

    Why it matters: Process without clear ownership is documentation nobody reads. This is also where you build clearer communication across teams into the structure  so context travels with the task, not separately from it.

    What breaks if you skip it: Tasks move forward without a decision-maker attached to them. When something goes wrong, the postmortem becomes a conversation about blame rather than process.

    Step 3: Document the repeatable tasks  not the one-offs

    What to do: Focus documentation on tasks that happen at least twice a month and involve more than one person. For each one: trigger, steps, owner, definition of done.

    Why it matters: These are your highest-leverage targets. One page of documentation on a task done 20 times a month has far more impact than a detailed playbook for something that happens once a quarter.

    What breaks if you skip it: Institutional knowledge stays stuck in whoever handled it last. When that person is unavailable, the task either stalls or gets done wrong.

    💡 Pro Tip: Keep every process document to one page where possible. If it’s longer, you’re probably documenting exceptions rather than the standard path. Write for the 80% case; handle exceptions as they arise.

    Step 4: Build approval paths into the workflow, not around it

    What to do: Move approval steps into your work management system  so they’re visible, assigned to a specific person, and create a record when completed.

    Why it matters: Approvals that live in inboxes are approvals waiting to be forgotten. In practice, this works best when approvals, task states, and notifications all live in the same system so decisions surface automatically rather than requiring manual follow-up.

    What breaks if you skip it: Work stalls at approval stages not because the approver is unresponsive, but because the request got buried. You end up with the same ‘I thought you approved it’ conversation on a loop.

    Skarya handles this by building approval workflows directly into boards  tasks can’t progress past certain stages until marked approved, and the right person is notified automatically. You can also automate the repetitive parts of your workflow timesheet submissions, status updates, and notifications  to cut the manual follow-up your team does by hand.

    Step 5: Centralise visibility so nothing lives in someone’s head

    What to do: Move the state of work into a live system where task status, ownership, and progress reflect reality in real time.

    Why it matters: When the whole team can see what’s in progress, what’s stuck, and what’s waiting on a decision, the number of ‘just checking in’ messages drops sharply. So does the cognitive load on whoever used to hold all that information in their head.

    What breaks if you skip it: You centralise the process without centralising the visibility. Work gets done, but nobody can see it happening  so you’re still chasing updates, just with a cleaner spreadsheet.

    What is workflow standardisation  and what is it not?

    A lot of resistance to standardisation comes from a reasonable fear: that it means more process, more approvals, more things to fill in before anything gets done. That fear is valid. It’s also not what standardisation is.

    Standardisation is NOT…Standardisation IS…
    A 12-step process document for every taskA clear path for repeat work  concise enough to follow without training
    Forcing every request through the same templateCategorising work so the right template applies to the right task
    Adding approval layers to slow decisions downPutting approvals in the right place so decisions happen faster
    Buying a new platform and calling it doneAgreeing on how work moves the tool supports that, it doesn’t create it
    Documentation that lives in a folder nobody opensProcess baked into the systems your team already uses every day

    The test is simple. Does this step reduce a judgment call your team has to make on a recurring task? If yes, it’s good standardisation. Does it add a checkpoint that exists mainly to create a paper trail? That’s bureaucracy. Cut it.

    What does good operations actually look like once workflows are standardised?

    It looks quieter. That’s the honest answer.

    But quieter translates into concrete outcomes that decision-makers can measure. Operations teams that standardise their core workflows consistently see:

    • Fewer missed handoffs  because context travels with the task, not in someone’s memory
    • Faster approval turnaround  because approvals surface in the workflow, not buried in an inbox
    • Less time on manual follow-up  because status is visible without anyone having to ask
    • Faster onboarding for new team members  because the process is written down, not inherited verbally
    • Fewer ‘who owns this?’ conversations because ownership is defined before work starts, not when something goes wrong

    Standardisation doesn’t mean your team stops thinking. It means they stop burning mental energy on questions that already have answers. Who owns this? What’s the process? Is it approved? Where does it go next? Those questions should never reach your inbox.

    Start with one messy recurring workflow this week  intake, approvals, or handoffs. Map where it breaks, simplify it, then standardise it. One fixed workflow builds more trust with your team than a full process overhaul ever will.

    Frequently Asked Questions

    How do operations teams standardise workflows?

    Operations teams standardise workflows by first auditing where recurring work comes from, then assigning clear ownership for each task category, documenting the standard path (not every exception), building approval steps into their work management system, and centralising visibility so progress is trackable without manual check-ins. The key is to start with the two or three highest-friction workflows rather than trying to overhaul everything at once.

    What is workflow standardisation in operations?

    Workflow standardisation in operations is the process of defining consistent, repeatable steps for how your team handles recurring work  from how requests come in, to how tasks are assigned and approved, to what completion looks like. The goal is predictable outcomes regardless of who handles the task. For service businesses and growing teams, it’s the difference between managed, scalable operations and constant firefighting.

    How do you standardise a process without adding bureaucracy?

    Focus every process step on reducing a judgment call, not adding a checkpoint. Ask: does this step help the task move forward, or does it just create a record? Keep documentation to one page where possible. Pilot new processes on two or three workflows before rolling them out team-wide. And involve the people doing the work in the design  they’ll spot the friction points a manager writing documentation from memory will miss.

    What tools help operations teams manage and standardise workflows?

    Work management platforms that handle task intake, assignment, approvals, and reporting in one place are the strongest fit. Skarya, Asana, Monday.com, and ClickUp are commonly used options for service teams. The most important feature to look for is the ability to build approval paths and task templates directly into the platform so the process lives in the system, not in someone’s memory or a separate document.

  • How to Streamline Business Operations: Fix the Right Things First

    How to Streamline Business Operations: Fix the Right Things First

    Most businesses misdiagnose their bottlenecks, failing to realize that no amount of new software or tightened processes can fix a fundamental design flaw. True streamlining requires a sequential approach: you must architect the underlying structure of how work is shaped before you can successfully optimize how it runs.

    How to Streamline Business Operations: Fix the Design, Not Just the Process

    When Growth Is the Thing That Breaks You

    Meridian Studio had a good problem. Three new client wins in a single month. For a nine-person brand and content agency in Melbourne, that’s the kind of run that should feel like momentum. Instead, the founder, Clara, spent that month drowning. The wrong creative brief went to the wrong client team. No one knew who had the final approval on a campaign that was already late. Clara was cc’d on 40 emails a day  not because she needed to be, but because no one else knew where decisions were supposed to land.

    Revenue was up. Operations were falling apart. And the instinct the one most founders reach for first  was to book a Monday morning standup, buy a project management tool, and start writing SOPs.

    That instinct is almost always wrong.

    Why the Standard Advice Makes Things Worse Before They Get Better

    The common playbook for streamlining business operations goes something like this: map your current processes, identify inefficiencies, add tools to fill the gaps, and document everything in SOPs. It’s tidy. It’s logical. And it’s usually the wrong starting point.

    The problem is that it treats operations as a collection of processes to be optimised rather than a structure to be designed. When you add tools and documentation on top of a structure that was never intentionally built  where ownership is unclear, information flow is informal, and handoffs happen by whoever happens to notice something needs doing, you don’t streamline anything. You just add more weight to a frame that was already bending.

    Clara did exactly this. She introduced a project management tool in week two of the chaos. Within a month, the tool had 47 open tasks, six of which were duplicates, and no one was certain which of the three people tagged on each card was actually responsible for moving it forward. The standup revealed blockers. It didn’t solve them. The SOPs sat in a shared Google Drive folder that four people had bookmarked and two had actually opened.

    The documentation was fine. The foundation it was sitting on was not.

    This is where most streamlining efforts stall. Not because the tools are wrong or the processes are badly written, but because the underlying architecture  who owns what, how decisions get made, where information lives  was never sorted out before anyone tried to optimise it.

    Tip:  Before adding any tool or process to your operations, ask one question: if this tool disappeared tomorrow, would we know how to do this work anyway? If the answer is no, the tool is covering a structural gap, not filling a real function.

    Operations Is a Design Problem, Not a Process Problem

    A designer working on a product doesn’t start by improving the checkout flow. They start by asking whether the product solves the right problem, whether the user journey makes sense end to end, and whether the architecture supports the experience they’re trying to create. Only after those questions are answered does individual flow optimisation become useful.

    Operations work the same way. The question isn’t ‘how do we run this process better?’ It’s ‘should this process exist in this form, owned by this person, sitting in this part of the business?’

    Process thinking optimises within the current structure. Design thinking questions whether the structure is right.

    Here’s what that looks like in practice:

    Process thinkingDesign thinking
    How do we speed up client approvals?Who actually owns client approvals?
    How do we reduce missed deadlines?Why is no one accountable for timeline changes?
    How do we improve handoffs between teams?What does a handoff even mean in our context?
    How do we track project status better?Why isn’t status visible without being chased?
    How do we reduce founder involvement?Why do tasks require founder involvement at all?

    Every question in the left column is worth answering eventually. But none of them can be answered well until the right column has been addressed first.

    For Meridian, the design problem was this: the agency had grown from three people to nine without anyone deliberately redesigning how work was structured. What worked informally at three  Clara, knowing everything, making every call, catching every drop became the ceiling at nine. The org hadn’t been redesigned. It had just been added to.

    Streamlining operations is not a process project. It is a design project with process as the output.

    The Order in Which to Fix Things (Most Businesses Start at Step Four)

    Once you accept that operations is a design problem, the sequence of fixes changes completely. Here is the order that actually works, and where most teams go wrong.

    Step one is to map what work actually exists. Not job titles. Not responsibilities as written in contracts. Actual tasks  the specific things people do every day to keep clients served and projects moving. This sounds basic, and it usually uncovers something uncomfortable: a significant portion of the work in most service businesses is invisible. It exists in someone’s head, someone’s inbox, or an informal agreement that no one wrote down. You cannot design a system around work you haven’t accounted for.

    Step two is to assign clear ownership. Not ‘the design team handles this’ but ‘Sam is the decision-maker on client creative approvals for accounts above $20,000.’ Ownership isn’t a responsibility matrix. It is a named person with the authority to make a call and the accountability for what happens next. Vague ownership is the single most common source of operational drag in service businesses.

    Step three is to define handoffs. A handoff is the moment work moves from one person to another. In most agencies, handoffs are the weakest point in the system  not because people are careless, but because no one has ever defined what ‘ready to hand off’ looks like. Before investing in automation or tooling, build handoffs before reaching for tools. What information needs to travel with the work? Who confirms receipt? What triggers the next step?

    Step four is where most businesses actually start: adding tools and automation. This is fine, once steps one through three are done. A project management platform, an AI assistant, a set of task automations  all of these work exactly as intended when the structure underneath them is solid. Skarya, for instance, is built so that clients, boards, tasks, and financial data all sit in one connected system but that architecture only pays off when teams have already defined who owns what and what a completed handoff looks like. The tool holds the structure. The structure has to come first.

    Tip:  When rolling out any operational change, announce it in the context of what it replaces, not just what it adds. ‘We are no longer tracking project status through email threads, this board is now the single source of truth’ lands better than ‘we are starting to use this board.’

    How to Know Your Operations Are Actually Streamlined

    There is a test that is more honest than any dashboard or efficiency metric. Can a new person join your team and understand how work gets done without the founder explaining it?

    Not a polished onboarding guide. Not a recorded walkthrough. Just the system, the structure, the documentation, the tools left to stand on their own. If a new team member can pick up a project, understand who owns what, know where to find information, and complete a handoff correctly in their first two weeks without pulling the founder in to clarify anything, the operation is working.

    This is the bar. Not automation rate. Not how fast tasks move. Not how many tools are integrated with each other. The measure of a streamlined operation is whether how your team communicates about work in progress is self-sustaining built into the structure rather than held together by one person’s memory.

    Meridian got there, eventually. Not by adding more. By removing the informal structures that had never been replaced and building deliberate ones in their place. Clara stopped being cc’d on everything not because she changed her communication style, but because the system no longer required her presence to function. Work had a shape. Ownership had names. Handoffs had definitions. The tool whatever tool could finally do its job, because the job was clearly defined.

    The Starting Point Is Not a Tool

    Every operations conversation eventually gets steered toward software. Which platform, which integration, which automation? These are fine questions. They are just not the first question.

    The first question is: what is the actual shape of the work? Who owns each piece of it? What does it mean for something to be finished and ready to move? When those answers exist, written down, agreed upon, and visible to the whole team, the right tool becomes obvious, and everything layered on top of it actually works.

    Streamlining business operations is not a subscription. It is not a process document. It is a decision, made once and maintained consistently, about how work is designed  not just how it is run.

    Frequently Asked Questions

    What does it actually mean to streamline business operations?

    Streamlining business operations means removing the friction between how work is structured, owned, and handed off so that work moves forward without requiring constant intervention. It is less about speed and more about clarity: who owns what, where decisions land, and how information travels between people.

    Why don’t new tools fix operational problems on their own?

    Tools optimise the flow of work. They cannot fix the structure that the work sits inside. When ownership is unclear, handoffs are informal, and accountability is spread across multiple people without definition, adding a tool tends to make the problem more visible without resolving it. The structure has to be designed before the tool can do its job.

    What is the right order to fix business operations?

    Start by mapping the actual work (not job titles). Then assign named ownership to each piece. Then define what a completed handoff looks like. Only after those three things are in place should you layer in tools, automation, or documentation. Most businesses start with step four and wonder why step one never gets resolved.

    How do you know when your operations are working well?

    The most honest test: can a new team member understand how work gets done, pick up a project, and complete a handoff correctly in their first two weeks without the founder explaining the system? If yes, the operation is functioning as designed. If not, there is a structural gap that no amount of optimisation will close

  • How to Automate Repetitive Business Tasks

    How to Automate Repetitive Business Tasks

    Automating repetitive business tasks means replacing manual, rule-based work with systems that handle it automatically, so your team can focus on work that actually requires human judgment.

    KEY TAKEAWAYS
    Repetitive tasks are any recurring actions that follow a fixed pattern and don’t require judgment to complete. They are prime candidates for automation.
    The most commonly automated tasks in service businesses include status reporting, timesheet reminders, invoice generation, approval workflows, and client onboarding steps.
    A task is ready to automate when it is documented, consistent, and costs your team more than 30 minutes per week.
    Automation doesn’t require an IT team. Most service businesses start with the tools they already use.
    The goal isn’t to remove people from the process. It’s to remove people from the parts that don’t need them.

    How to Automate Repetitive Business Tasks

    TL;DR: Automating repetitive business tasks means replacing manual, rule-based work with systems that handle it automatically. Service businesses typically reclaim 5 to 10 hours per team member per week by automating status updates, timesheet tracking, reporting, and approval workflows. This guide covers which tasks to automate, how to know when a task is ready, and how to start without overhauling your entire operation.

    Marcus runs a 12-person digital agency. Every Friday afternoon, he and two of his project leads spend a combined three hours doing the same things: chasing timesheet submissions, pulling data from their project boards to write client status emails, and formatting a weekly summary report that nobody has ever questioned whether it needed to exist in its current form.

    By the time Monday arrives, around 15 hours of team time have gone into work that didn’t require anyone’s expertise to produce. Work that, if you stopped to look at it honestly, follows the same steps every single week without variation.

    This is the quiet problem in most service businesses. Not chaos, not bad people, not even bad processes. Just a slow accumulation of manual tasks that repeat themselves indefinitely because nobody has gotten around to doing anything about them.

    The Difference Between Work That Needs You and Work That Doesn’t

    Not every task that lands on your plate actually needs you to do it. That sounds obvious, but most teams never make a clear distinction between work that requires human judgment and work that just requires a human to be present.

    Repetitive tasks are the second kind. They follow a fixed pattern, produce a predictable output, and happen on a regular schedule. The clearest test: if you could write down every step and hand the instructions to a new team member on their first day, and they would get the exact same result, the task is repetitive. If the answer involves any version of ‘it depends,’ a person probably belongs in the loop.

    Task TypeExamplesAutomation Potential
    RepetitiveTimesheet reminders, status emails, invoice generation, recurring task creation, approval notificationsHigh
    Judgment-basedClient strategy, creative direction, conflict resolution, proposal writing, relationship managementLow
    HybridProject reporting (auto-generate data; human adds commentary). Client onboarding (auto-send docs; human does the intro call).Medium

    Most service businesses, when they actually map this out, find that somewhere between 30 and 40 percent of their weekly admin work falls cleanly into the repetitive category. Not because their teams are inefficient, but because nobody has taken the time to separate the two.

    How to Know When a Task Is Ready to Automate

    Identifying a repetitive task is one thing. Knowing whether it’s actually ready to hand off to a system is another. A task is ready to automate when three conditions are true: it is documented, it is consistent, and it costs your team enough time to justify the setup.

    Documentation comes first. If the process lives only in someone’s head, automation will reproduce every gap and inconsistency along with the steps. Before you automate anything, document the process as a standard operating procedure. This forces the workflow into a format a system can actually follow, and it often reveals steps that are messier than they looked.

    Consistency comes second. Automation works when the inputs and outputs stay predictable. A task that shifts depending on the client, the week, or who is handling it needs to be standardised before it can be automated. You can’t set rules for a process that doesn’t have any yet.

    Time cost comes third. A task that takes five minutes once a month probably isn’t worth the setup effort. A task that takes 90 minutes every week across three team members is a different conversation entirely. Multiply the time by the number of people doing it and by the frequency, and the real cost becomes difficult to ignore.

    When teams inside Skarya.ai run this three-question test against their workflows, the same tasks keep surfacing as the highest-priority candidates: timesheet follow-ups, board status updates, and recurring client reports. Not because these tasks are complicated, but because they are frequent, consistent, and genuinely don’t need a person to complete them.

    The Tasks Service Teams Automate First

    Five categories of work consume the most manual time in service businesses, and all five are strong candidates for automation from day one.

    Timesheet management. Chasing timesheets is one of the most consistent time drains in agencies and consulting firms. A reminder that fires automatically every Thursday afternoon, for anyone who hasn’t submitted their hours yet, takes minutes to configure and eliminates hours of weekly follow-up. In Skarya.ai, timesheets flow directly from the weekly entry grid into a manager approval queue, and once approved, that data feeds the CFO Dashboard where revenue, cost, and margin per client update automatically. Nobody copies a number into a spreadsheet.

    Status reporting. The status updates that eat into meeting time exist because nobody has connected the project data to the report. When tasks are tracked on a board and completion percentages are live, status reports can be generated from real data rather than assembled from memory. Marcus’s team went from four hours of manual formatting each week to 45 minutes of review and send.

    Client onboarding steps. Every new client triggers the same sequence: send the welcome pack, share access to the project board, schedule the kickoff call, create the initial task set. Most of this can be templated and triggered automatically when a new client record is created in your system, rather than rebuilt from scratch by a project manager each time.

    Invoice generation. For businesses on retainers or fixed-fee models, invoices follow a predictable pattern. Automating their generation from approved timesheet data removes a manual bottleneck and reduces billing errors that come from manually transcribing hours across tools.

    Internal approvals. Approvals that sit in inboxes create downstream project delays. Routing them automatically with deadline reminders, whether for budget sign-off, scope changes, or timesheet authorisation, keeps work moving without someone having to follow up manually every time.

    A Practical Starting Point for Any Team

    The right way to start isn’t to overhaul your tools or set up complex integrations. It’s to pick one high-frequency task, document it properly, and replace the manual steps with a system that handles it consistently.

    Here is a straightforward path that works for most service teams:

    1. Audit your week. Ask every team member to track how they spend their time for five working days and flag anything they do more than once. The patterns emerge quickly.
    2. Rank by time cost. Calculate how much time each repetitive task consumes across the whole team each week. Automate in order of time cost, not order of ease.
    3. Document before you touch the automation. Write out the exact steps, triggers, and expected outputs. A badly documented process, once automated, is just a faster badly documented process.
    4. Build inside tools you already have. You don’t need a new platform to start. Skarya.ai’s Kobi AI can create tasks, boards, and full project setups from a single text prompt, which replaces the manual setup that most project managers do from scratch at the start of every engagement.
    5. Run a two-week parallel test. Keep the manual process running alongside the automated version. If the outputs are consistent, retire the manual version.
    6. Track the reclaimed time. Note what your team does with the hours they get back. This builds the case for automating the next task on the list.

    One thing worth saying plainly: don’t automate a broken process. If the underlying workflow has problems, the automation will reproduce those problems faster and make them harder to catch. Fix the process first, then hand it to a system.

    What the Numbers Look Like in Practice

    Back to Marcus. After mapping his team’s weekly admin against the three-question test, he started with timesheets. Within Skarya.ai, his team logs hours directly against tasks on their project boards. Submitted timesheets route automatically to manager approval. Once approved, that data feeds straight into the CFO Dashboard, where Marcus can see earned revenue, total cost, and margin per client in real time.

    He didn’t build any custom integrations. He didn’t hire a developer. He configured what was already in the platform.

    TaskBefore AutomationAfter Automation
    Timesheet collection3 hrs/week chasing and consolidating20 min review only
    Weekly client status reports4 hrs/week formatting manually45 min review and send
    Invoice preparation2 hrs/week30 min approvals only
    Internal approval follow-ups2 hrs/weekNear zero

    That’s roughly 10 hours a week returned to his team, across five people, from four tasks. Not from a major technology investment, but from systematically removing the manual steps from work that didn’t require them.

    One thing Marcus didn’t expect: Skarya.ai’s Risk Alerts section in the CFO Dashboard flagged two clients where margin had dropped below the threshold he’d set, giving him an early warning before either project created a billing problem. That kind of visibility isn’t possible when the data lives in spreadsheets that get updated once a week by hand.

    Automation Isn’t About Doing Less. It’s About Doing Better.

    The concern that comes up most often is that automation will strip the personal touch out of how a business operates. That it will make things feel mechanical or reduce the quality of what clients experience.

    That concern confuses the mechanism with the outcome. Automation removes the friction between your team and the clients they serve. When the weekly report compiles itself, the person who used to spend 90 minutes building it has 90 minutes to spend on a client problem, a creative decision, or a conversation that actually needs their attention.

    The teams that get this right don’t automate everything. They automate the tasks that don’t need a person, which means the people they have can fully show up for the work that does.

    If you want to see what that looks like in a single platform, Skarya.ai connects timesheets, project boards, client data, and financial reporting so the work of pulling it all together happens automatically, and your team gets back to what they’re actually there to do.

    Frequently Asked Questions

    Is business task automation only for large companies?

    No. Automation is arguably more valuable for small and mid-sized service businesses, where every team member handles multiple roles and admin overhead has a direct impact on delivery capacity. Most work management platforms, including Skarya.ai, are designed for teams of 5 to 50 people. You don’t need an IT department or a developer to get started. The barrier is usually documentation and process clarity, not technical skill.

    Do I need to be technical to automate tasks in my business?

    Not for the tasks that drain the most time in a service business. Timesheet reminders, status reporting, approval notifications, and task creation can all be automated inside modern work management platforms without writing any code. Kobi AI in Skarya.ai creates projects, boards, and task sets from a plain-text prompt. If you can describe the process in plain language, the system can handle the rest.

    What is the difference between automation and AI in a business context?

    Automation follows fixed rules to complete a task the same way every time. If a timesheet hasn’t been submitted by Thursday, send a reminder. AI goes a step further: it reads context, makes decisions, and generates outputs that vary based on the situation. Most business task automation sits in the rule-based category. AI becomes part of the picture for tasks like writing project summaries, generating reports from unstructured data, or surfacing patterns across a portfolio. Skarya.ai’s Kobi AI does both: it runs fixed workflow automation and produces contextual outputs like board summaries and project reports on demand.

    How quickly do teams see results from automating repetitive tasks?

    Most teams notice a meaningful reduction in admin time within the first two to three weeks of automating their first high-frequency task. The largest gains typically come in the first 90 days, as teams work through three to five core repetitive tasks. The compounding effect is where the real value builds: each automated task frees time that gets redirected toward delivery, client relationships, or growth work, which changes the economics of how the business operates.